Measuring fleet productivity with telematics can help improve efficiency and save your business money.
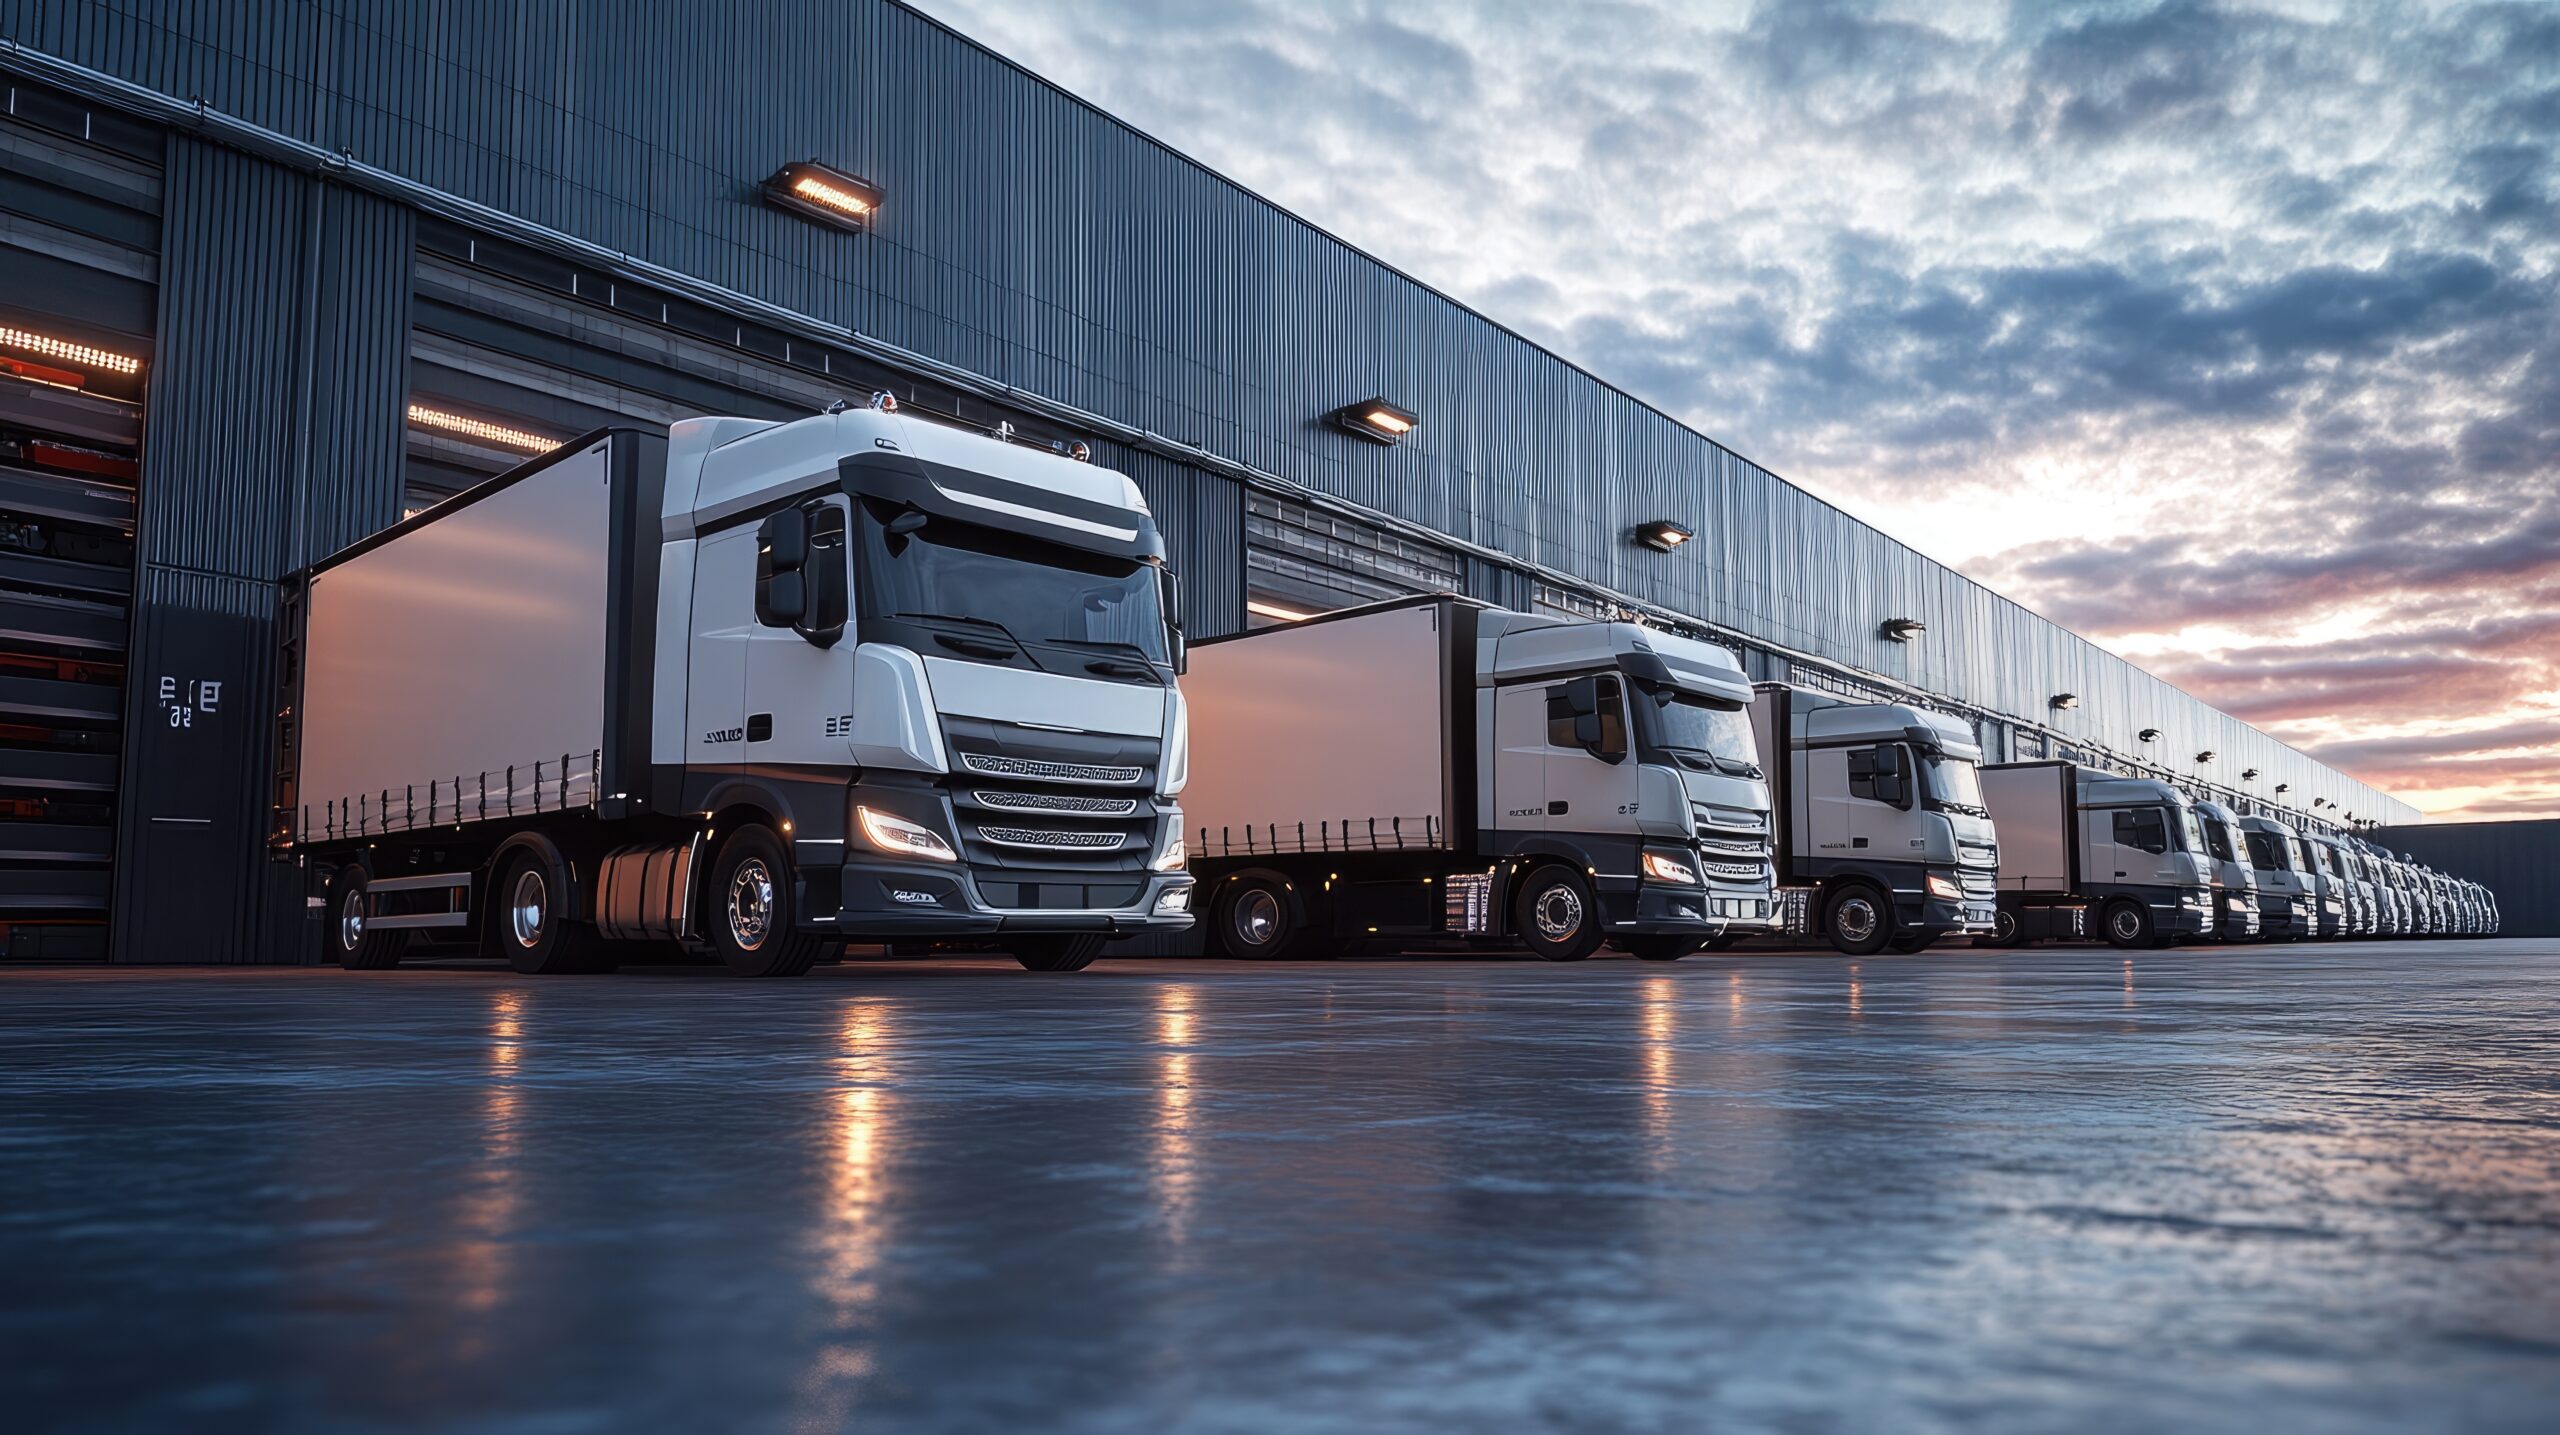
Key objectives of a fleet manager are to ensure fleet productivity as well as managing costs and even reducing them. Trying to achieve this can be a challenge for businesses when labour and fuel costs are increasing rapidly. Improving productivity not only helps you to reduce business costs but also provide a better service to your customers.
Telematic technology provides fleet managers in-depth visibility over their vehicles, helping businesses allocate assets where they’re needed most. In this blog, we discuss several cost-control strategies to increase productivity utilising the Geotab GO device data.
What is fleet productivity?
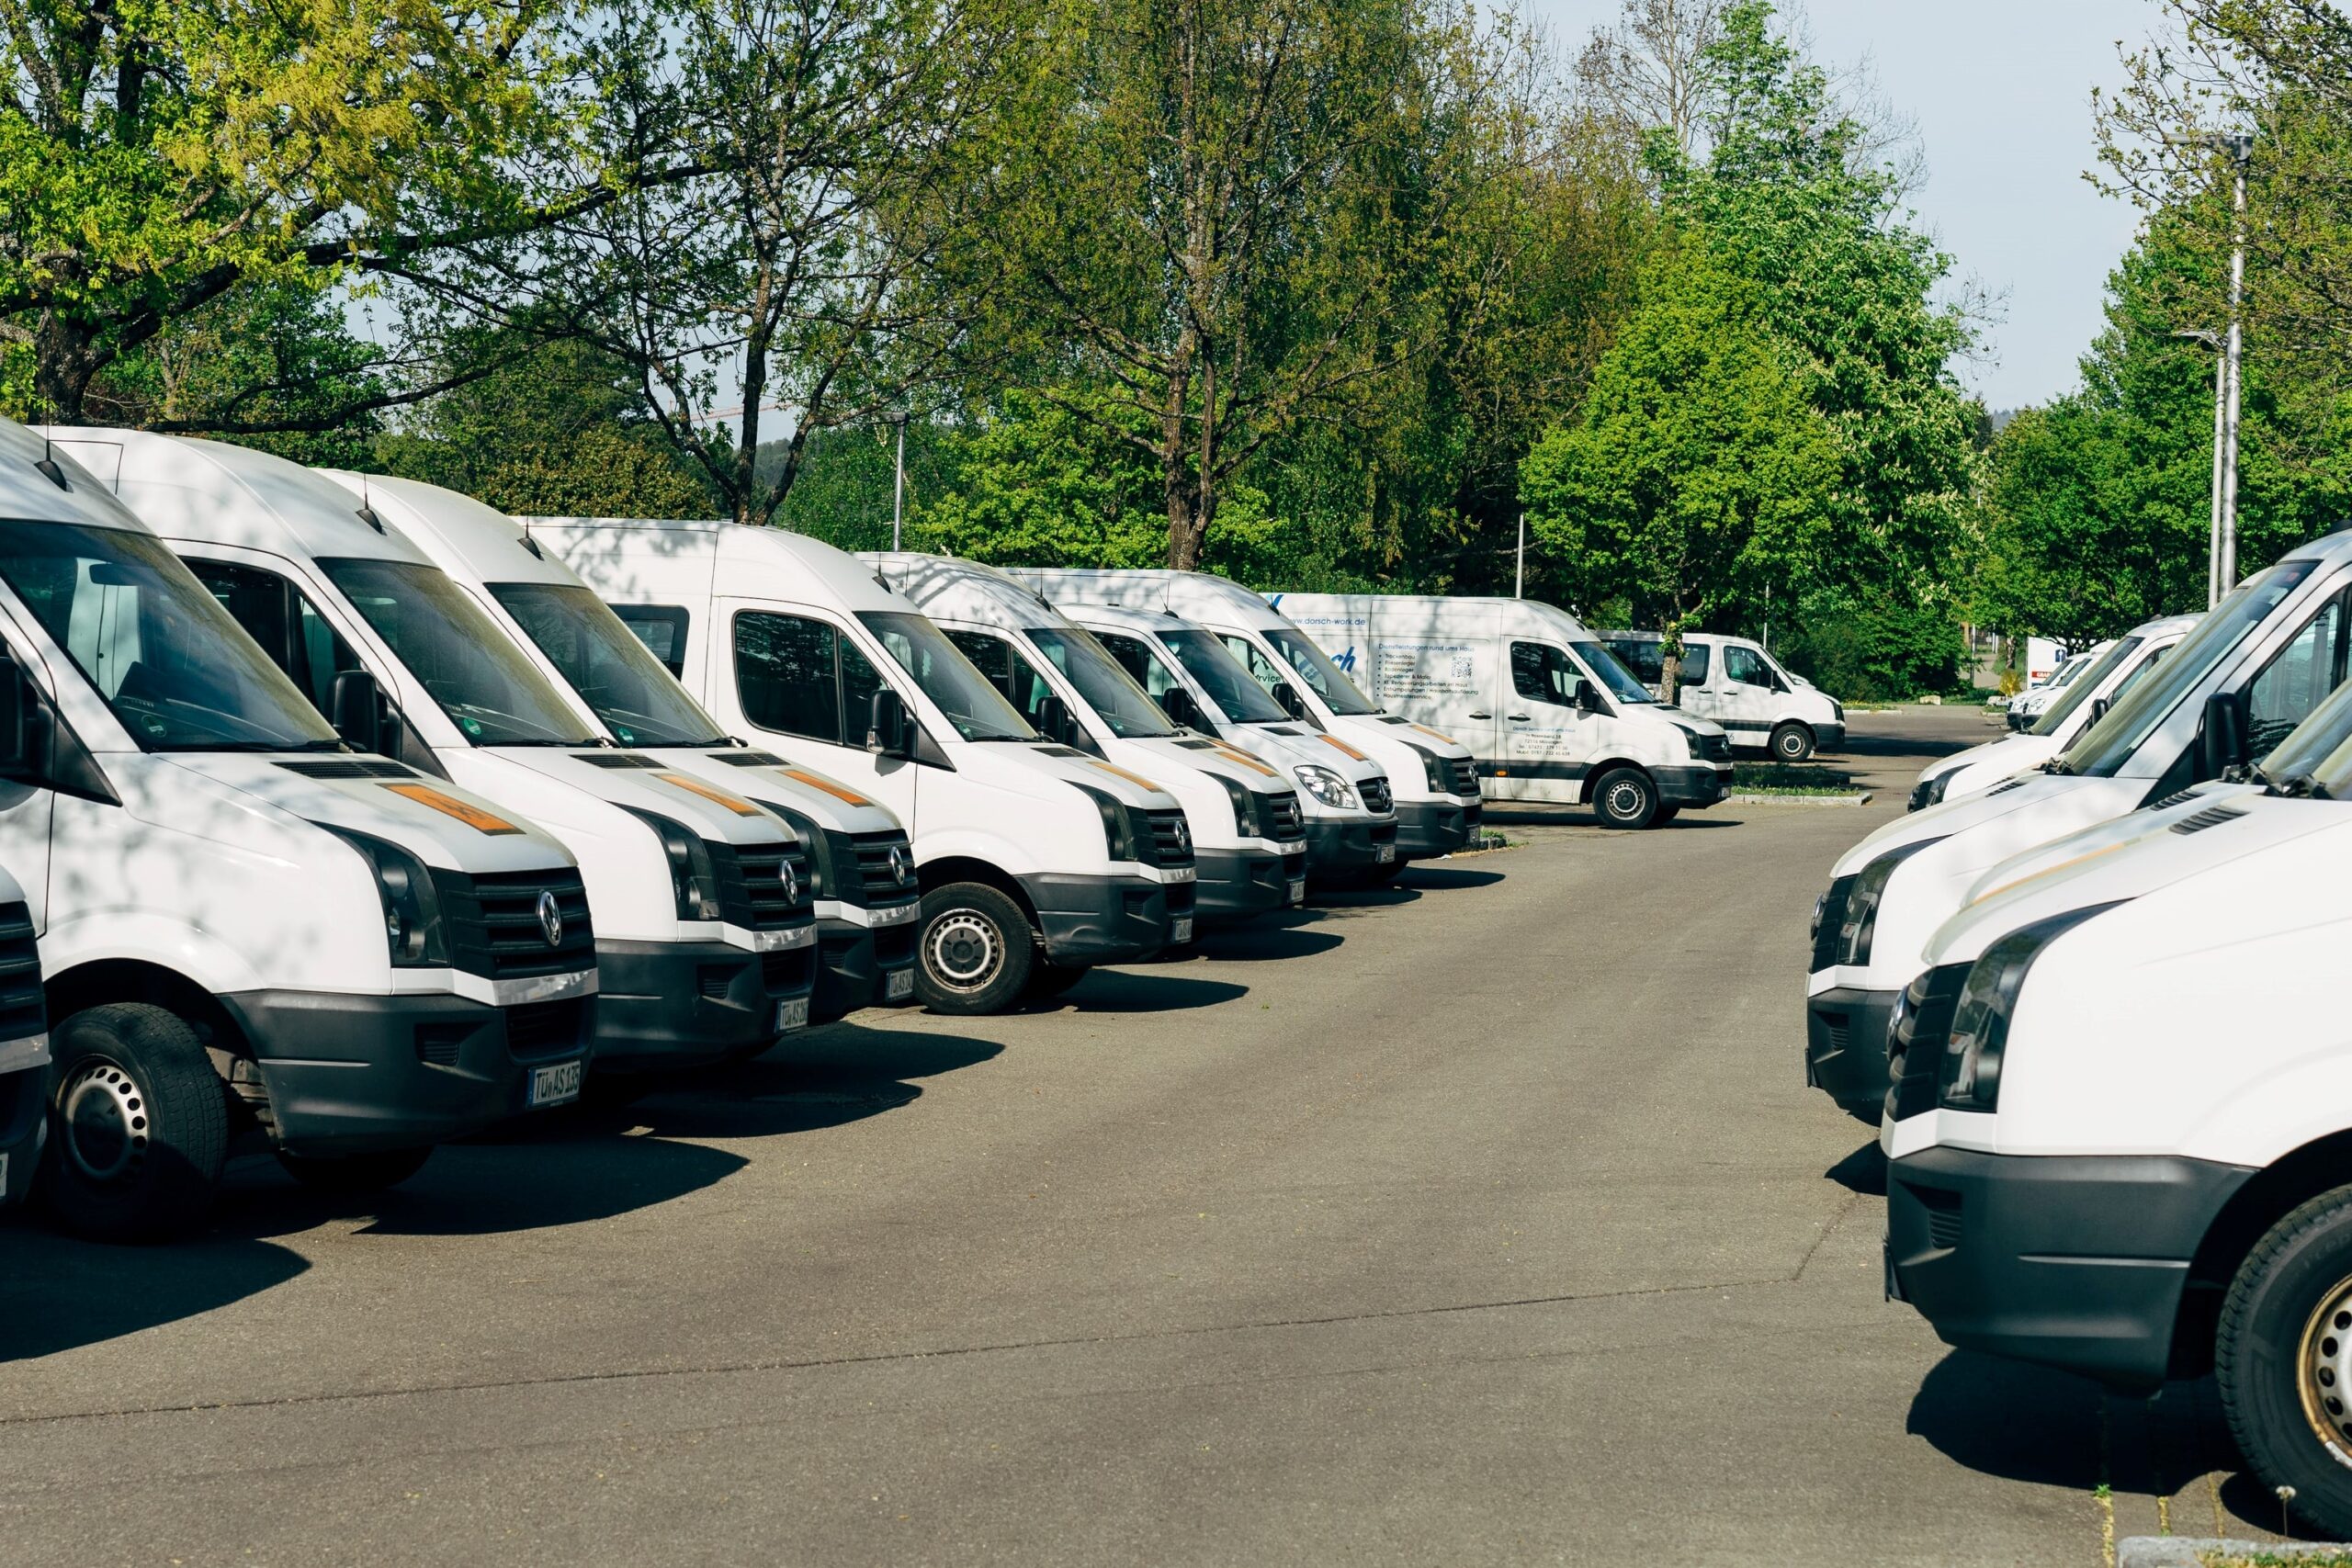
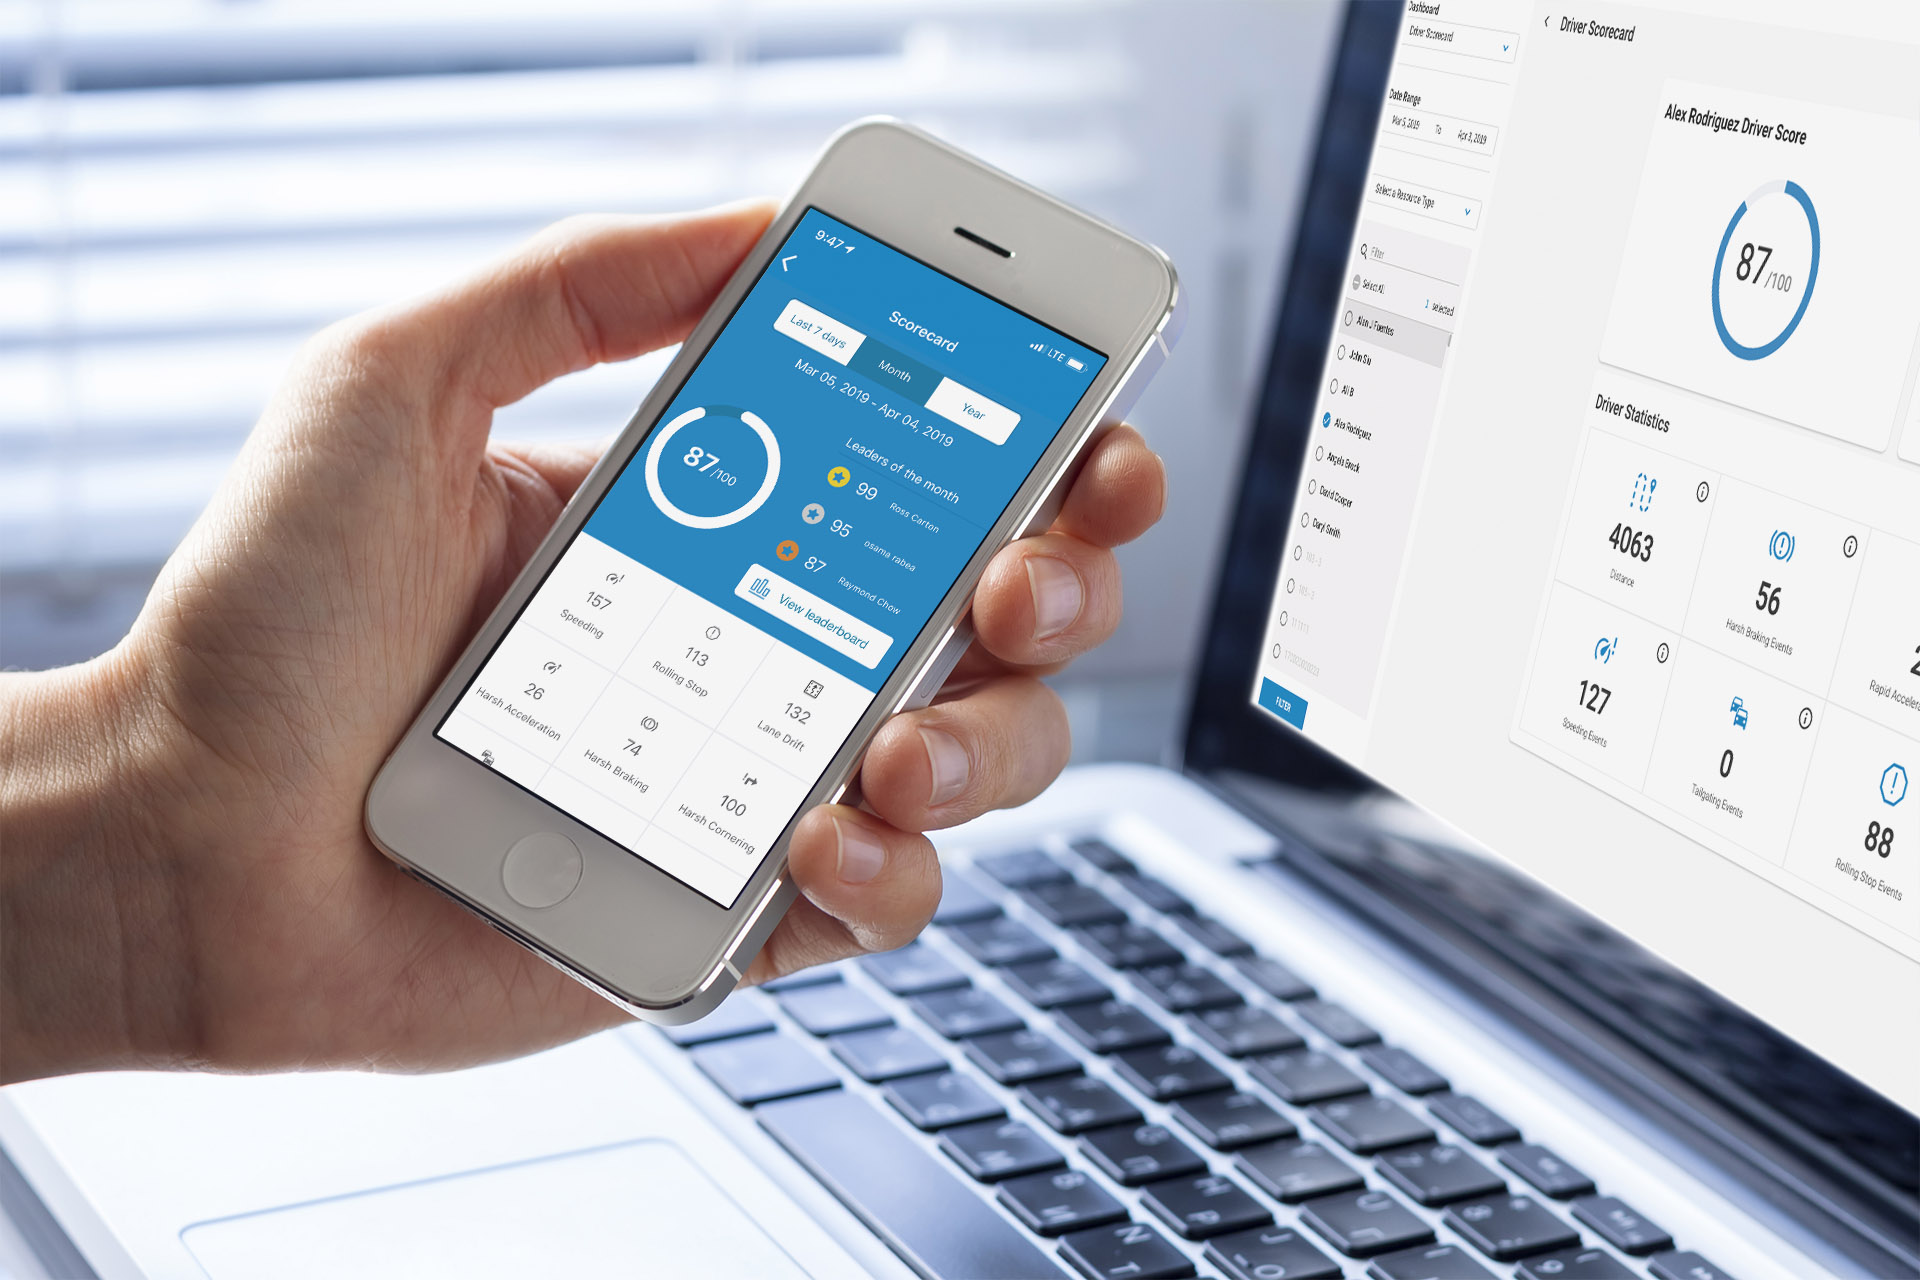
Fleet productivity is the basic measure of employee work output. One way to pinpoint how you can improve on productivity is to create a productivity scorecard to objectively measure performance. This will help a business identify what is working well and areas for improvement.
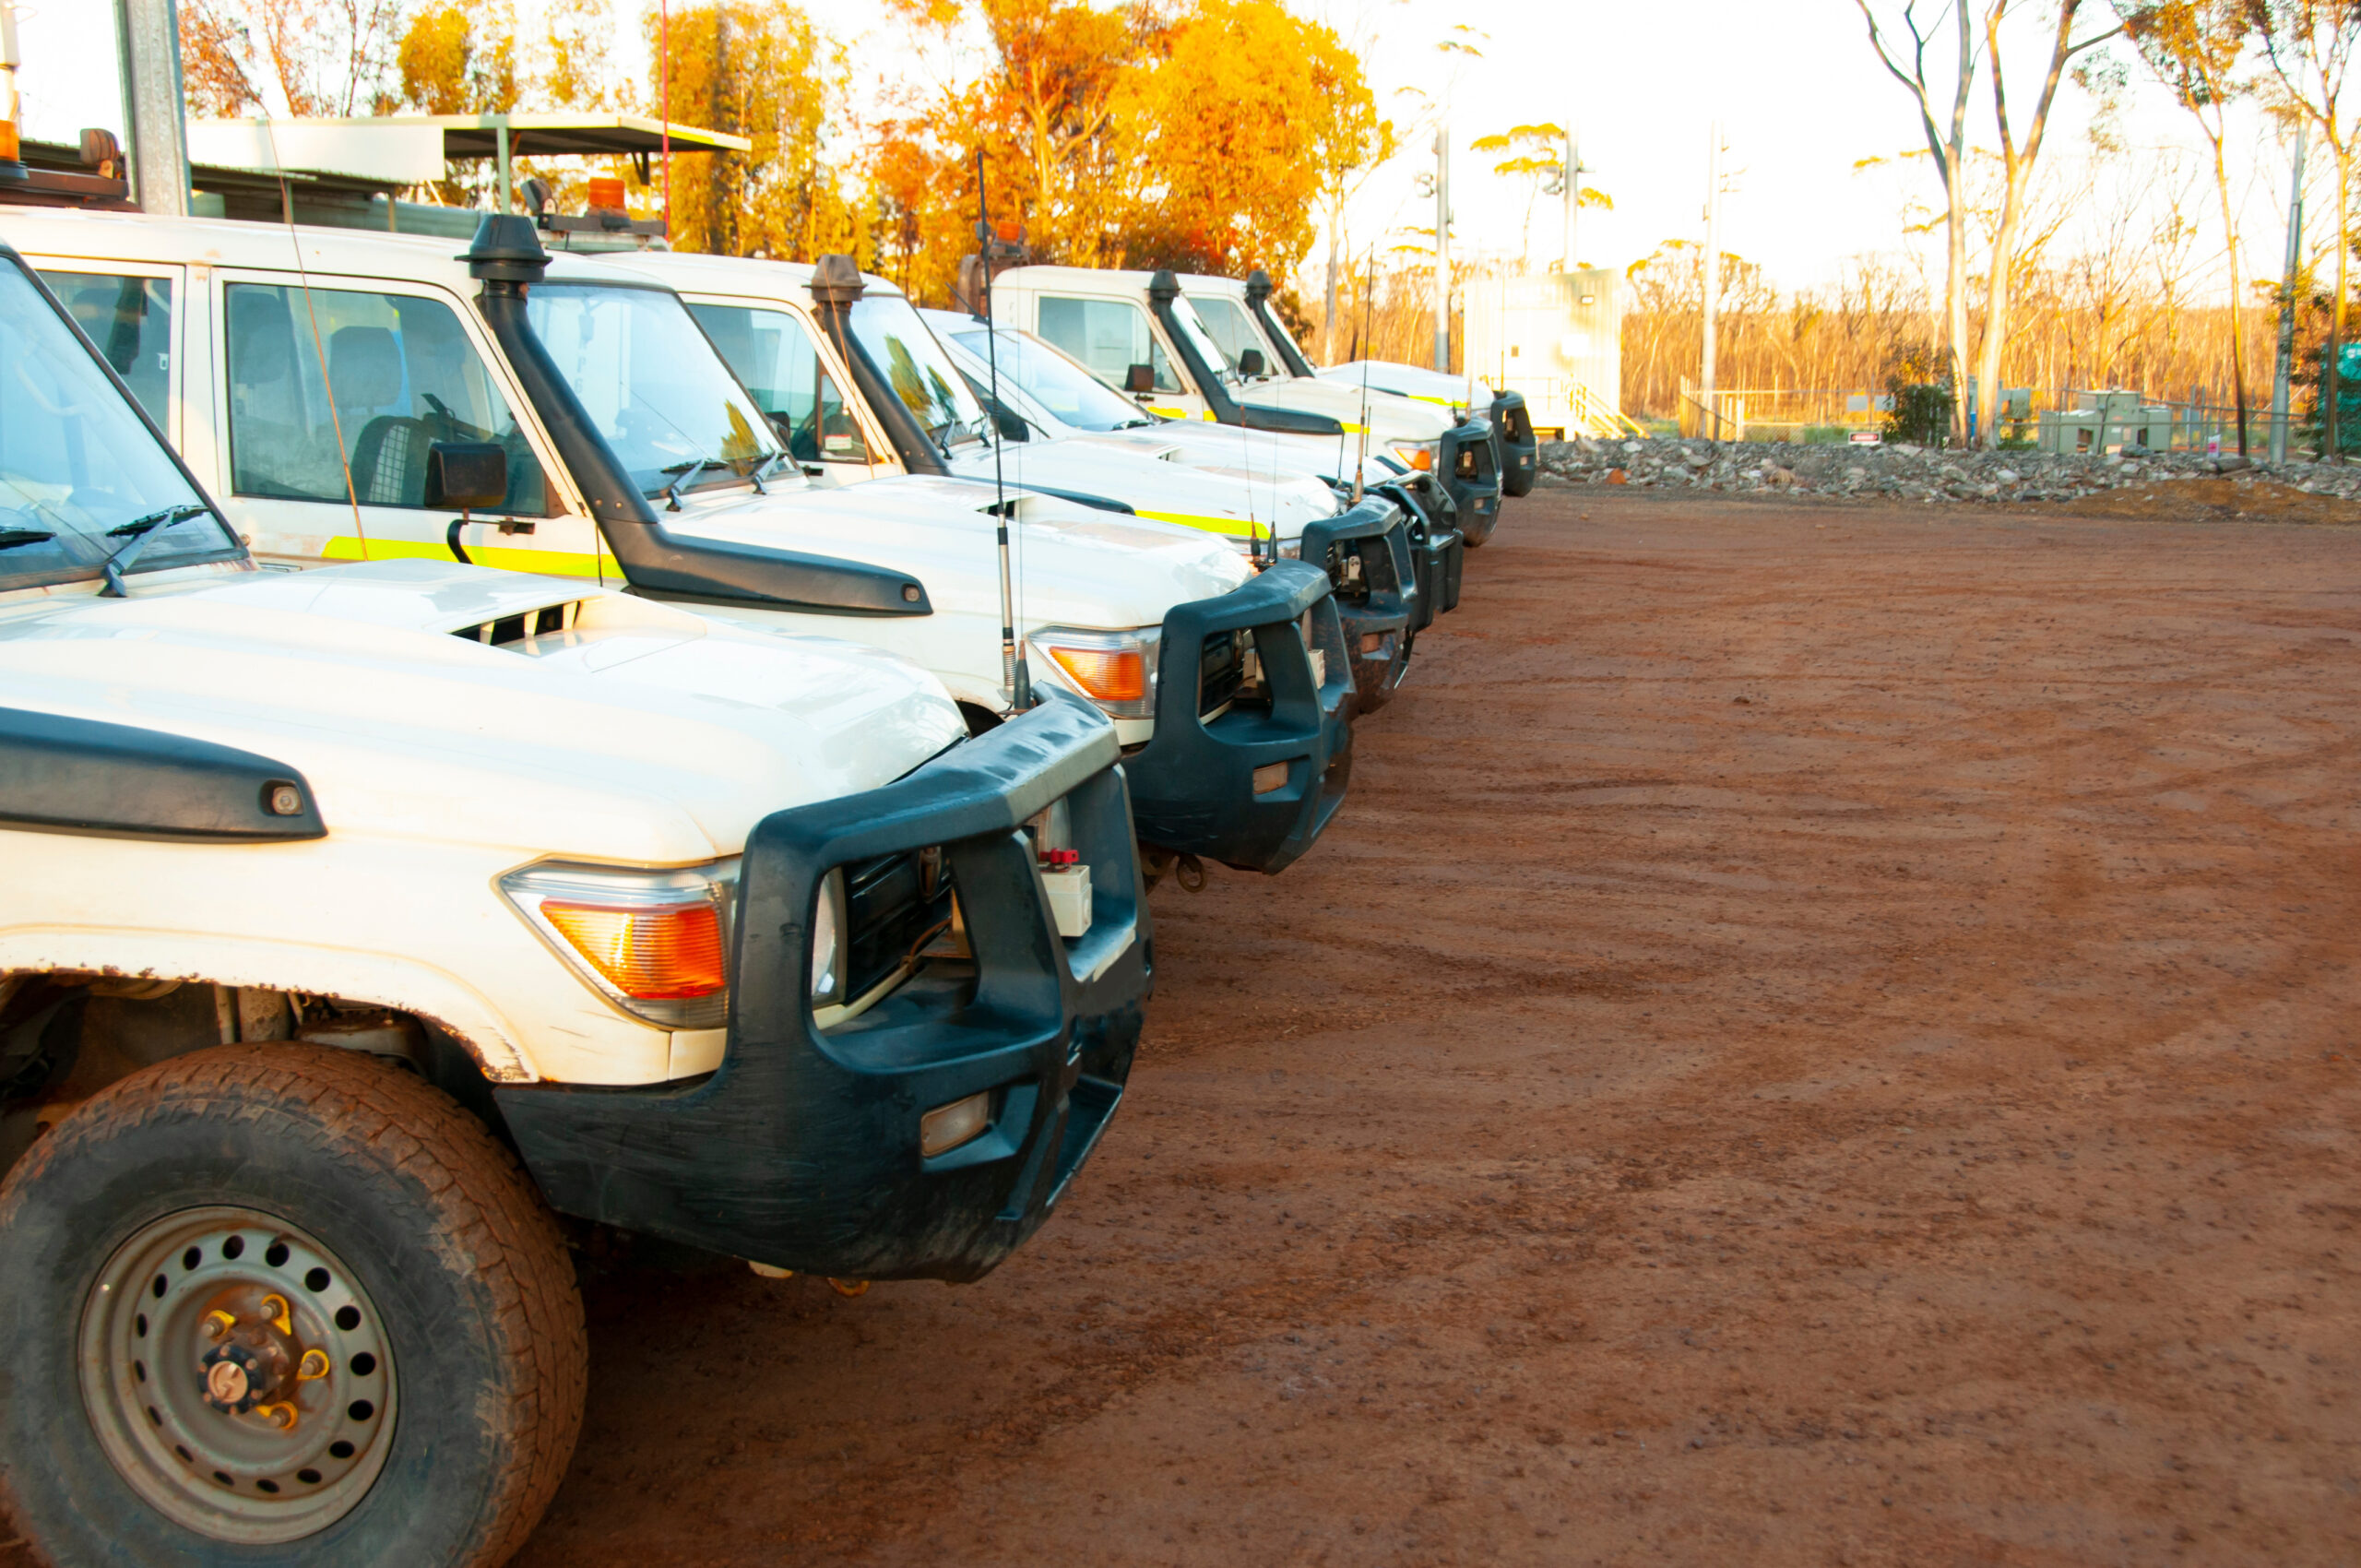
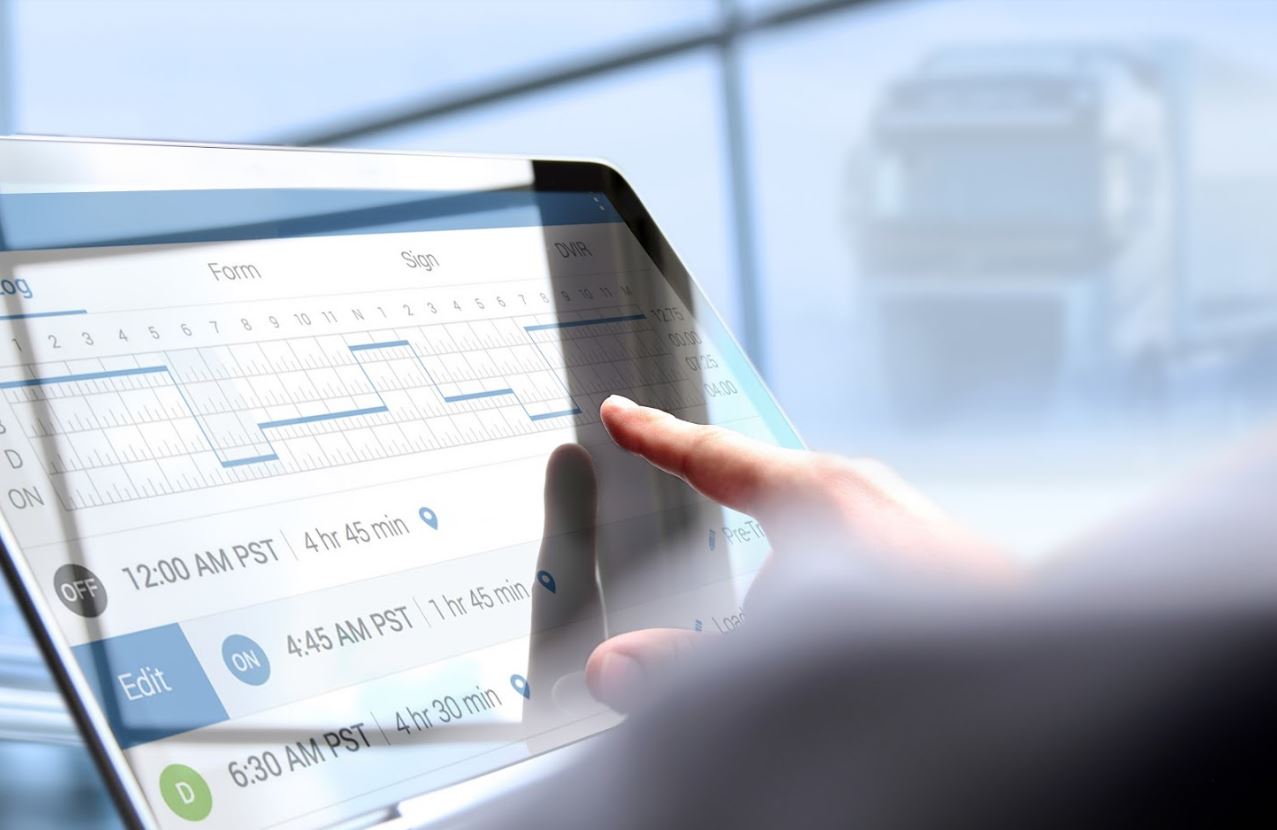
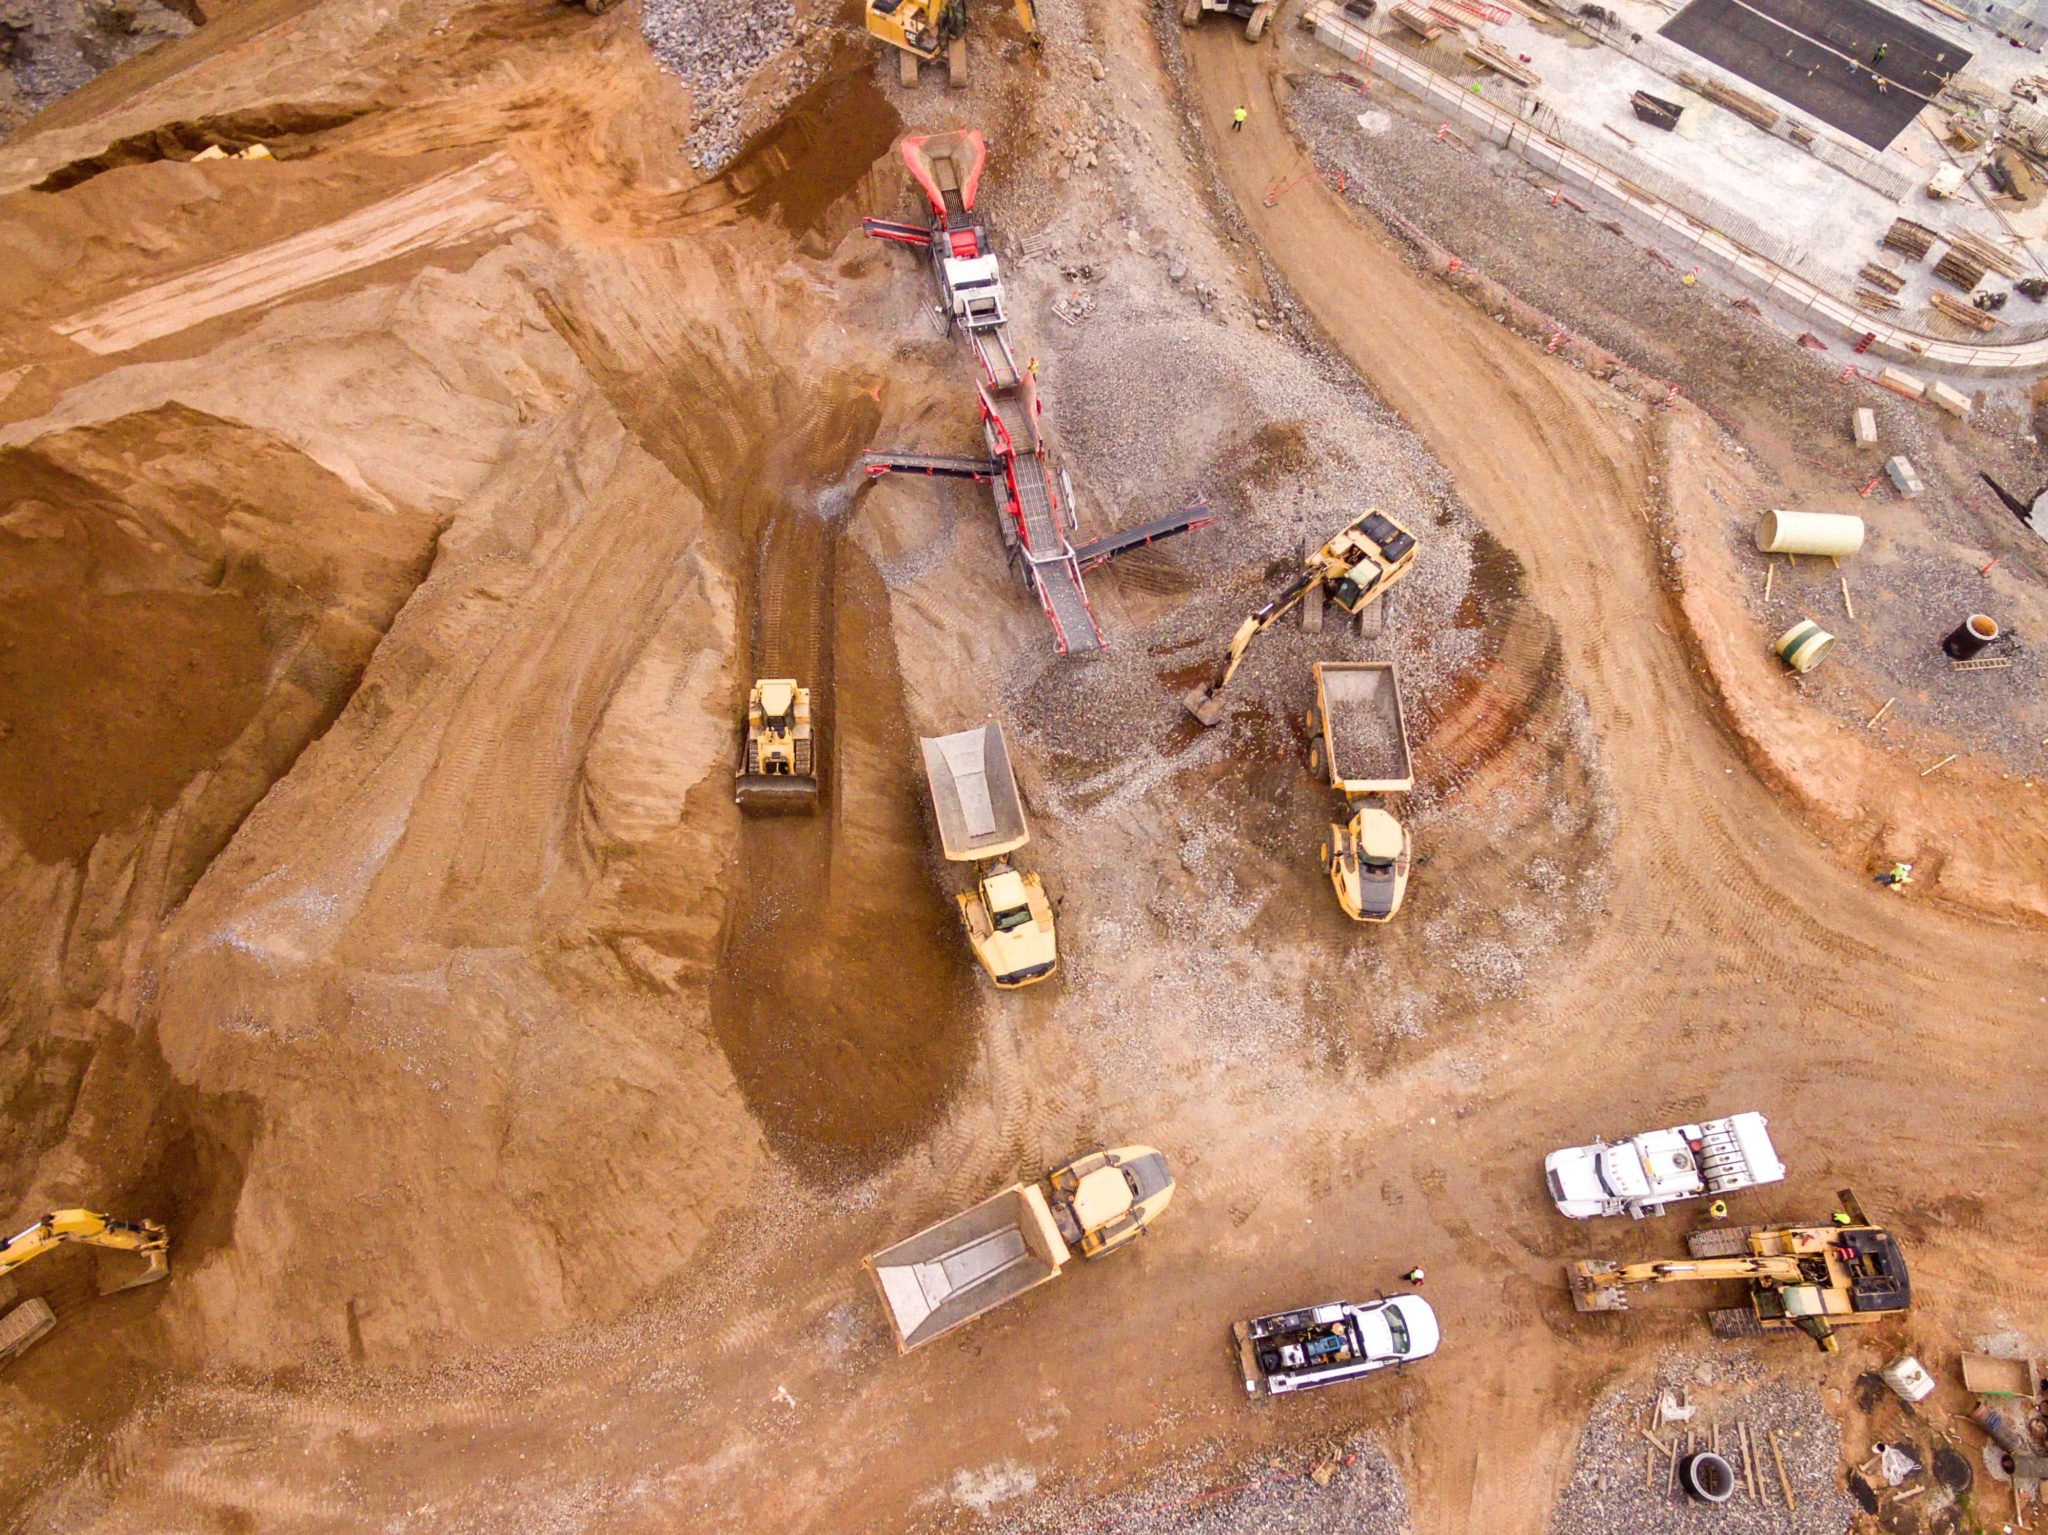
Setting up 100% visibility over vehicle utilisation and productivity of jobs allows businesses to ensure that the hours being paid match up to the hours worked. Gaining a single hour of driver productivity per day, multiplied monthly, yearly, can make a big difference.
Its important to remember that achieving 100% productivity is not realistic, especially when some factors are out of your employees control, e.g. weather conditions and traffic.

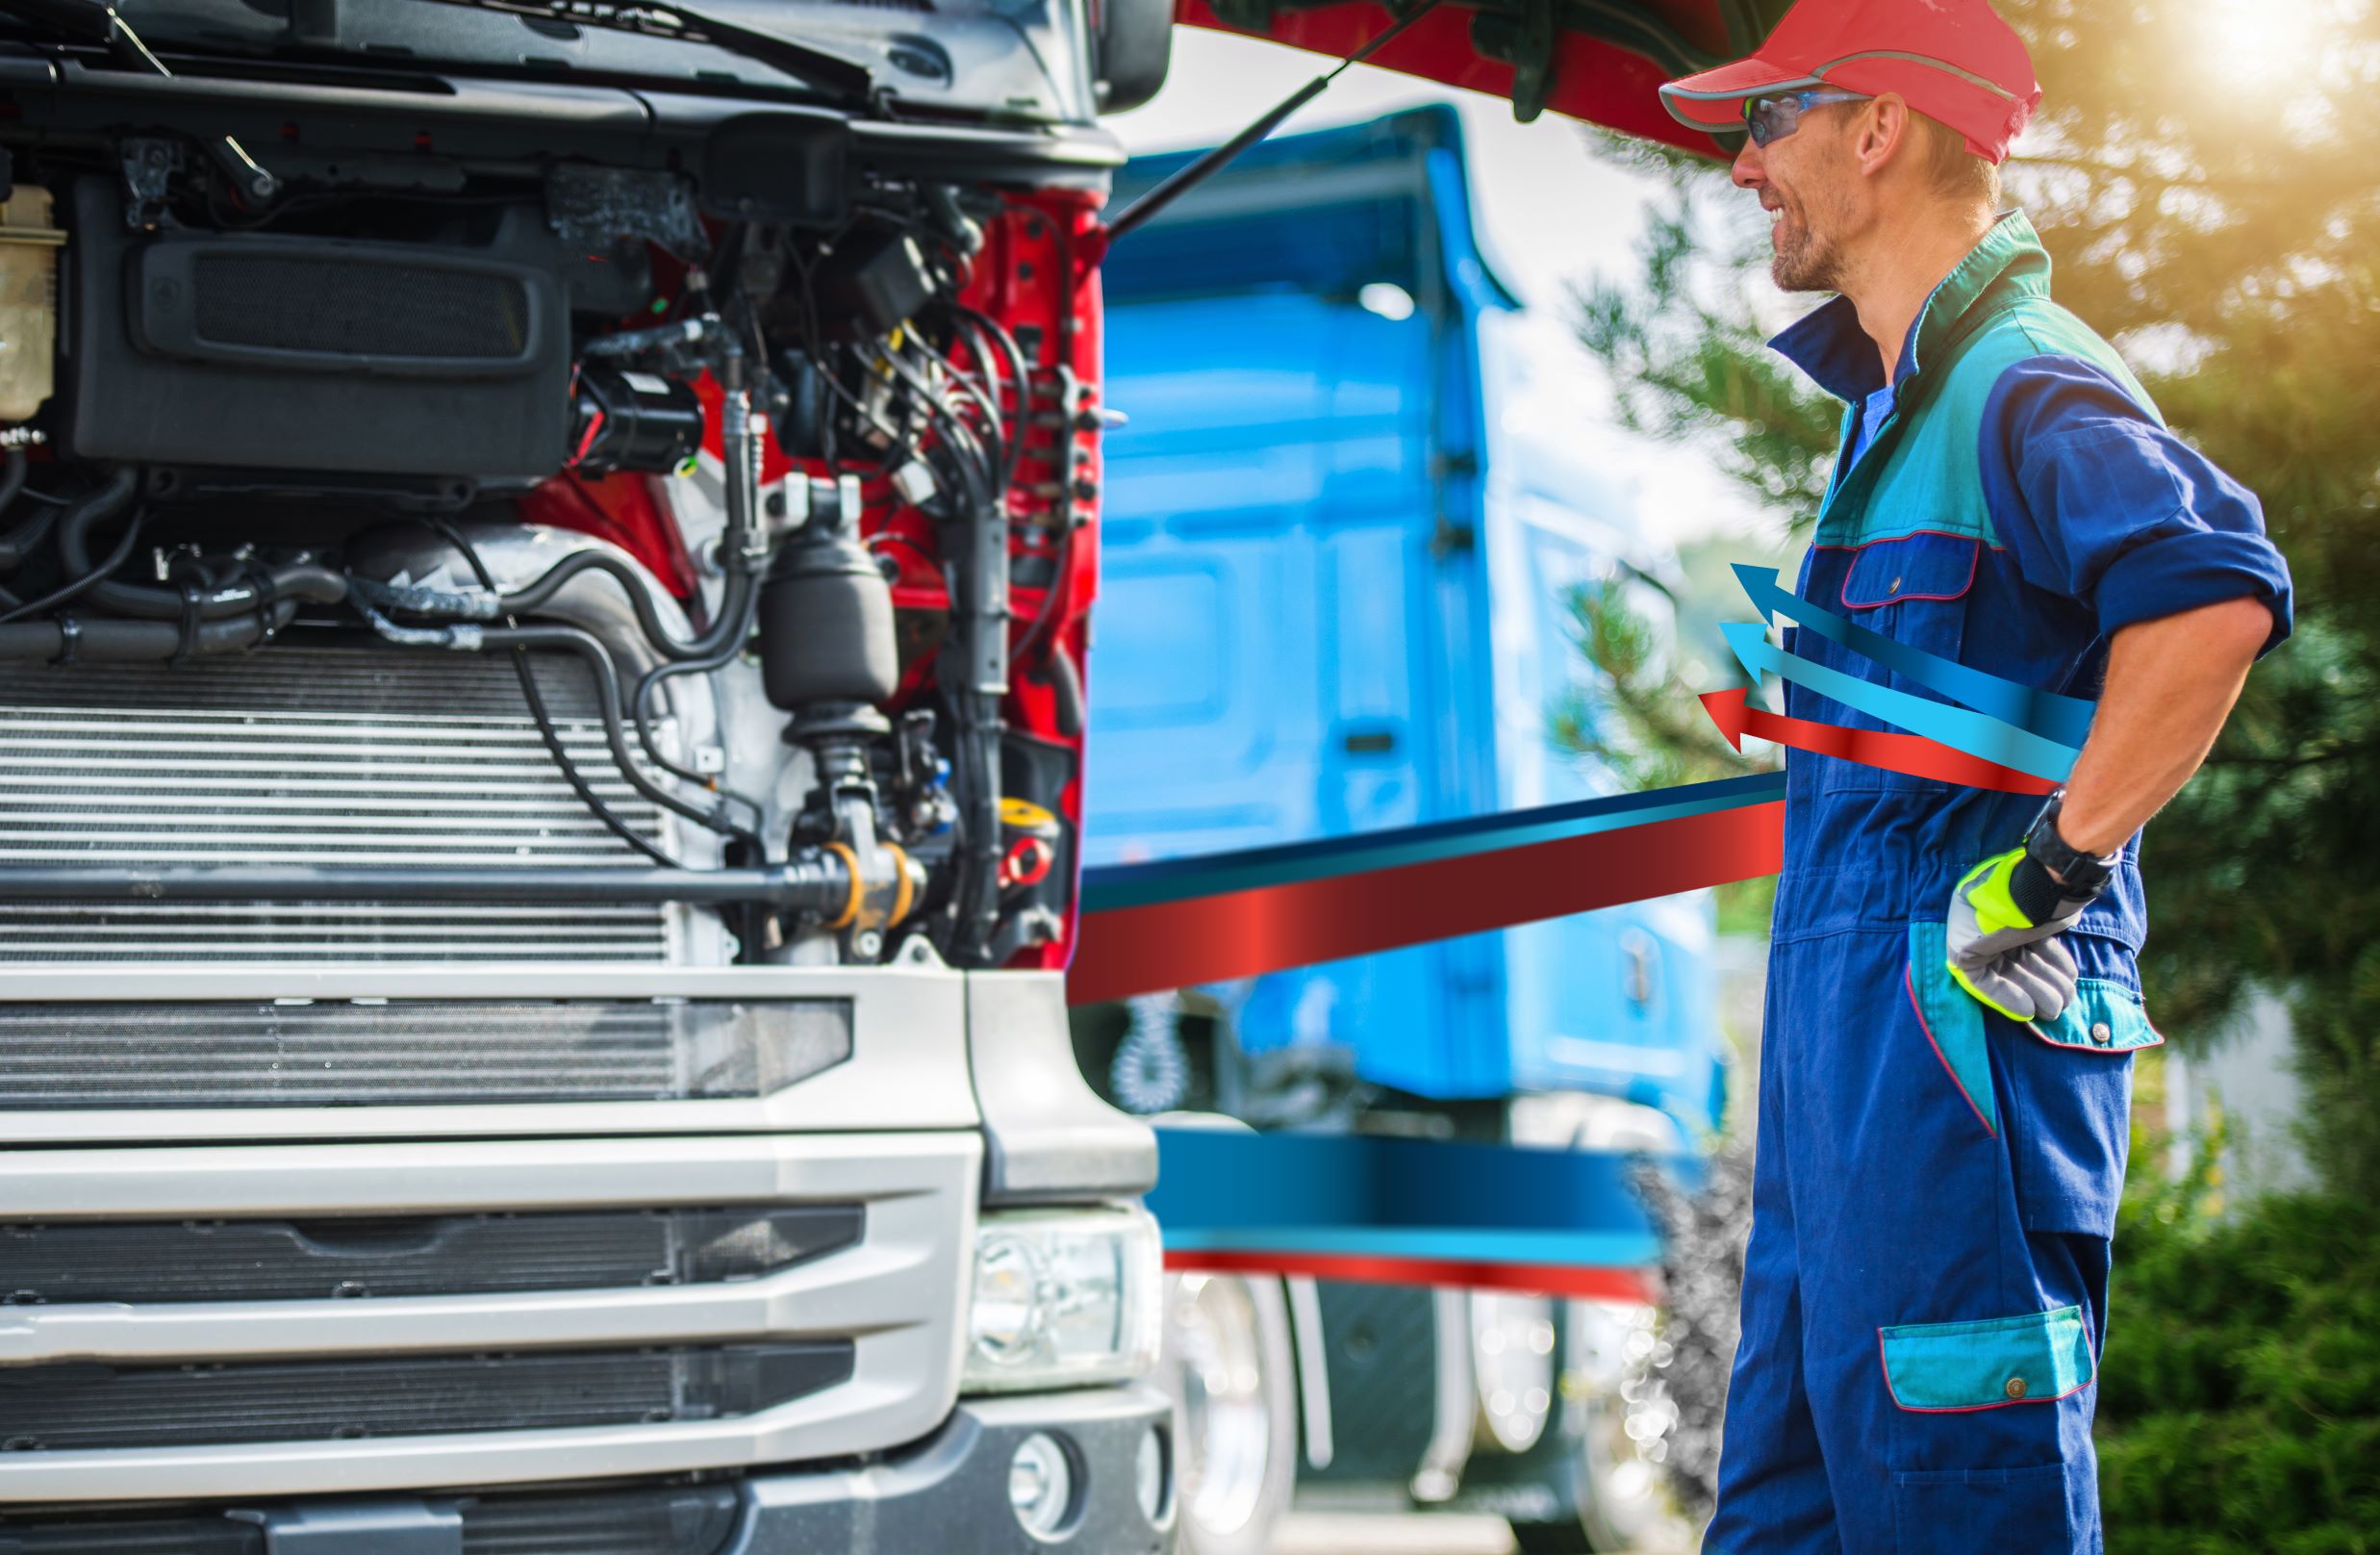
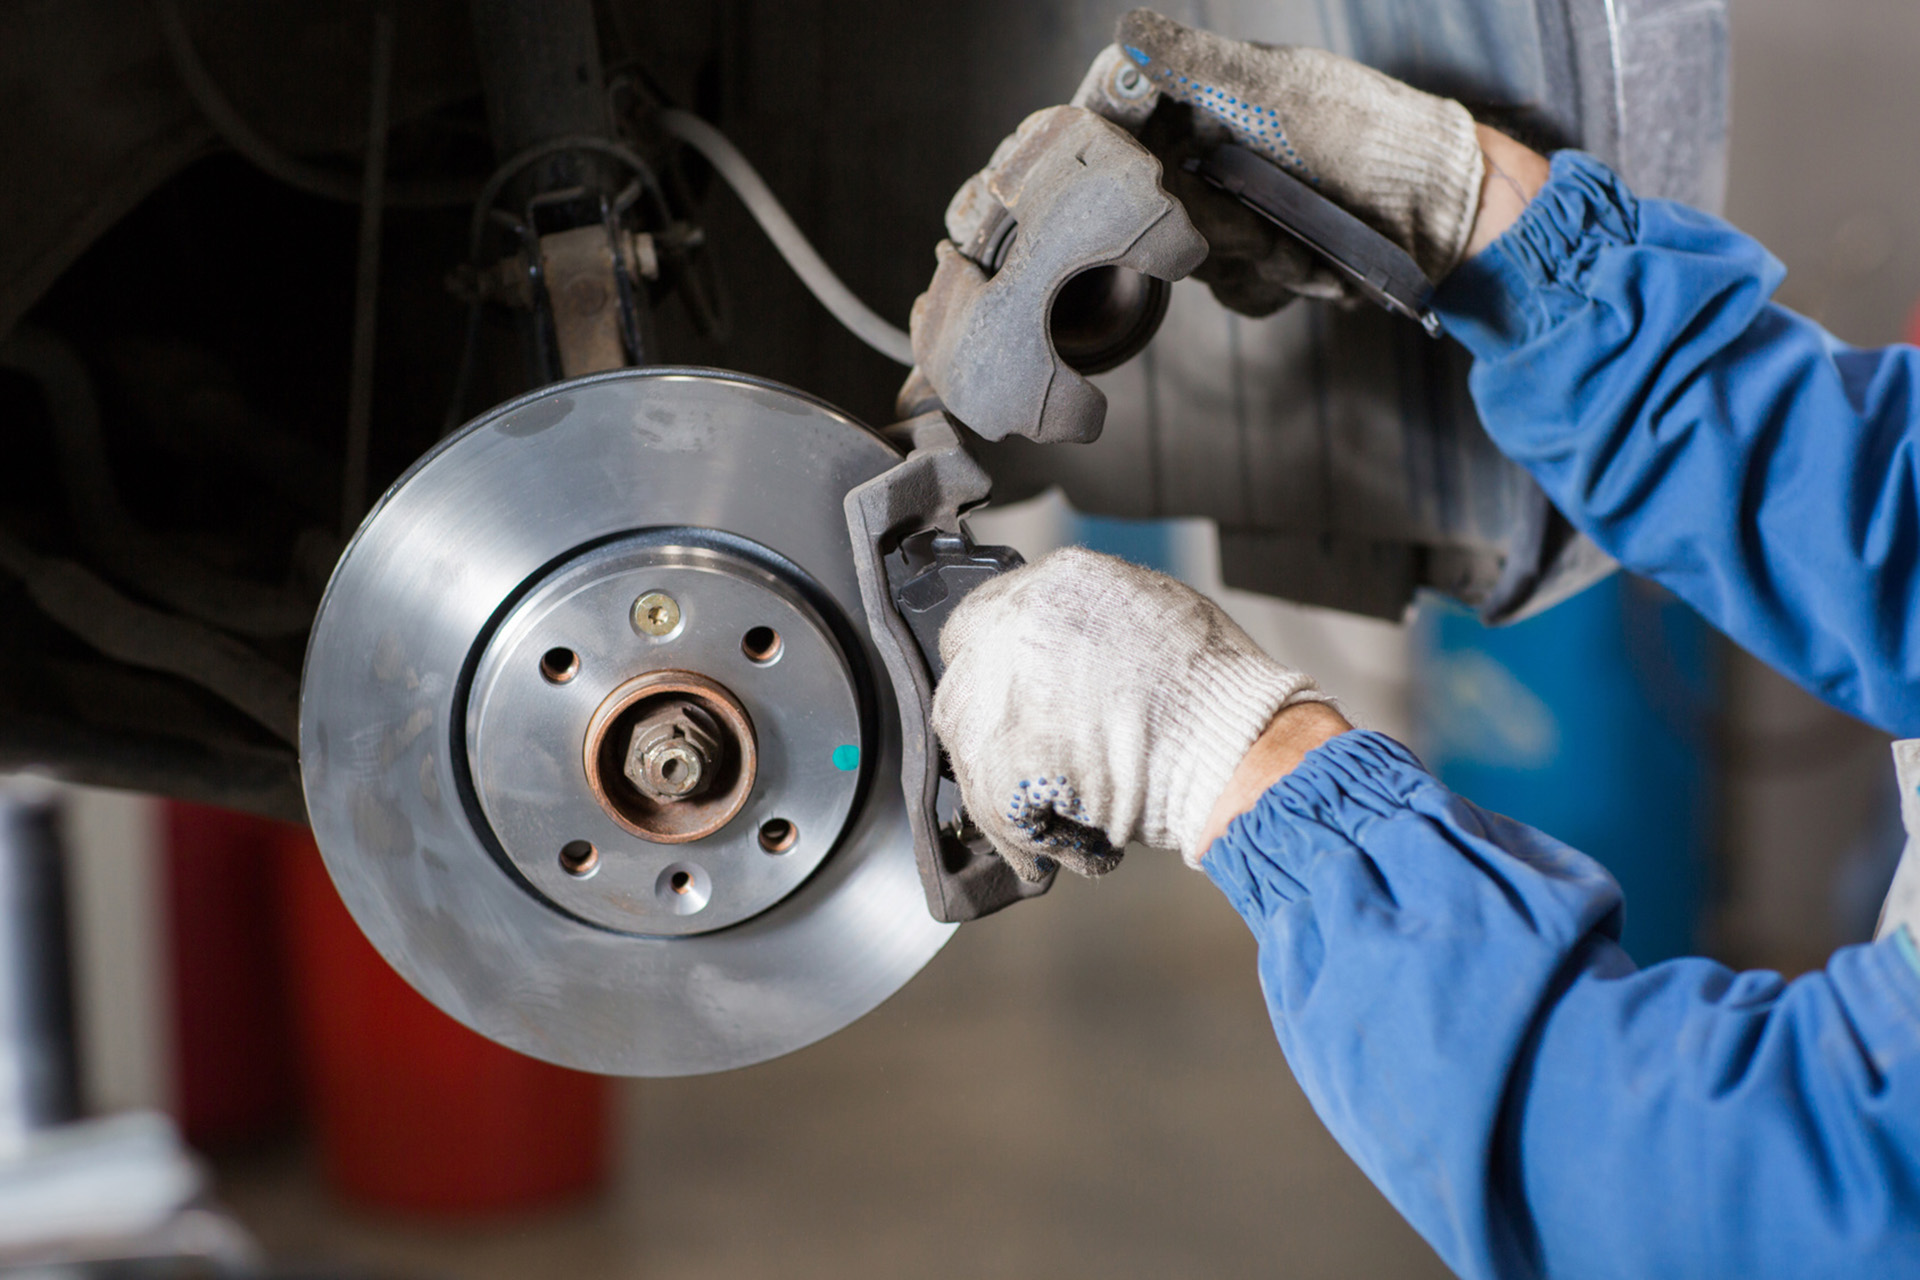
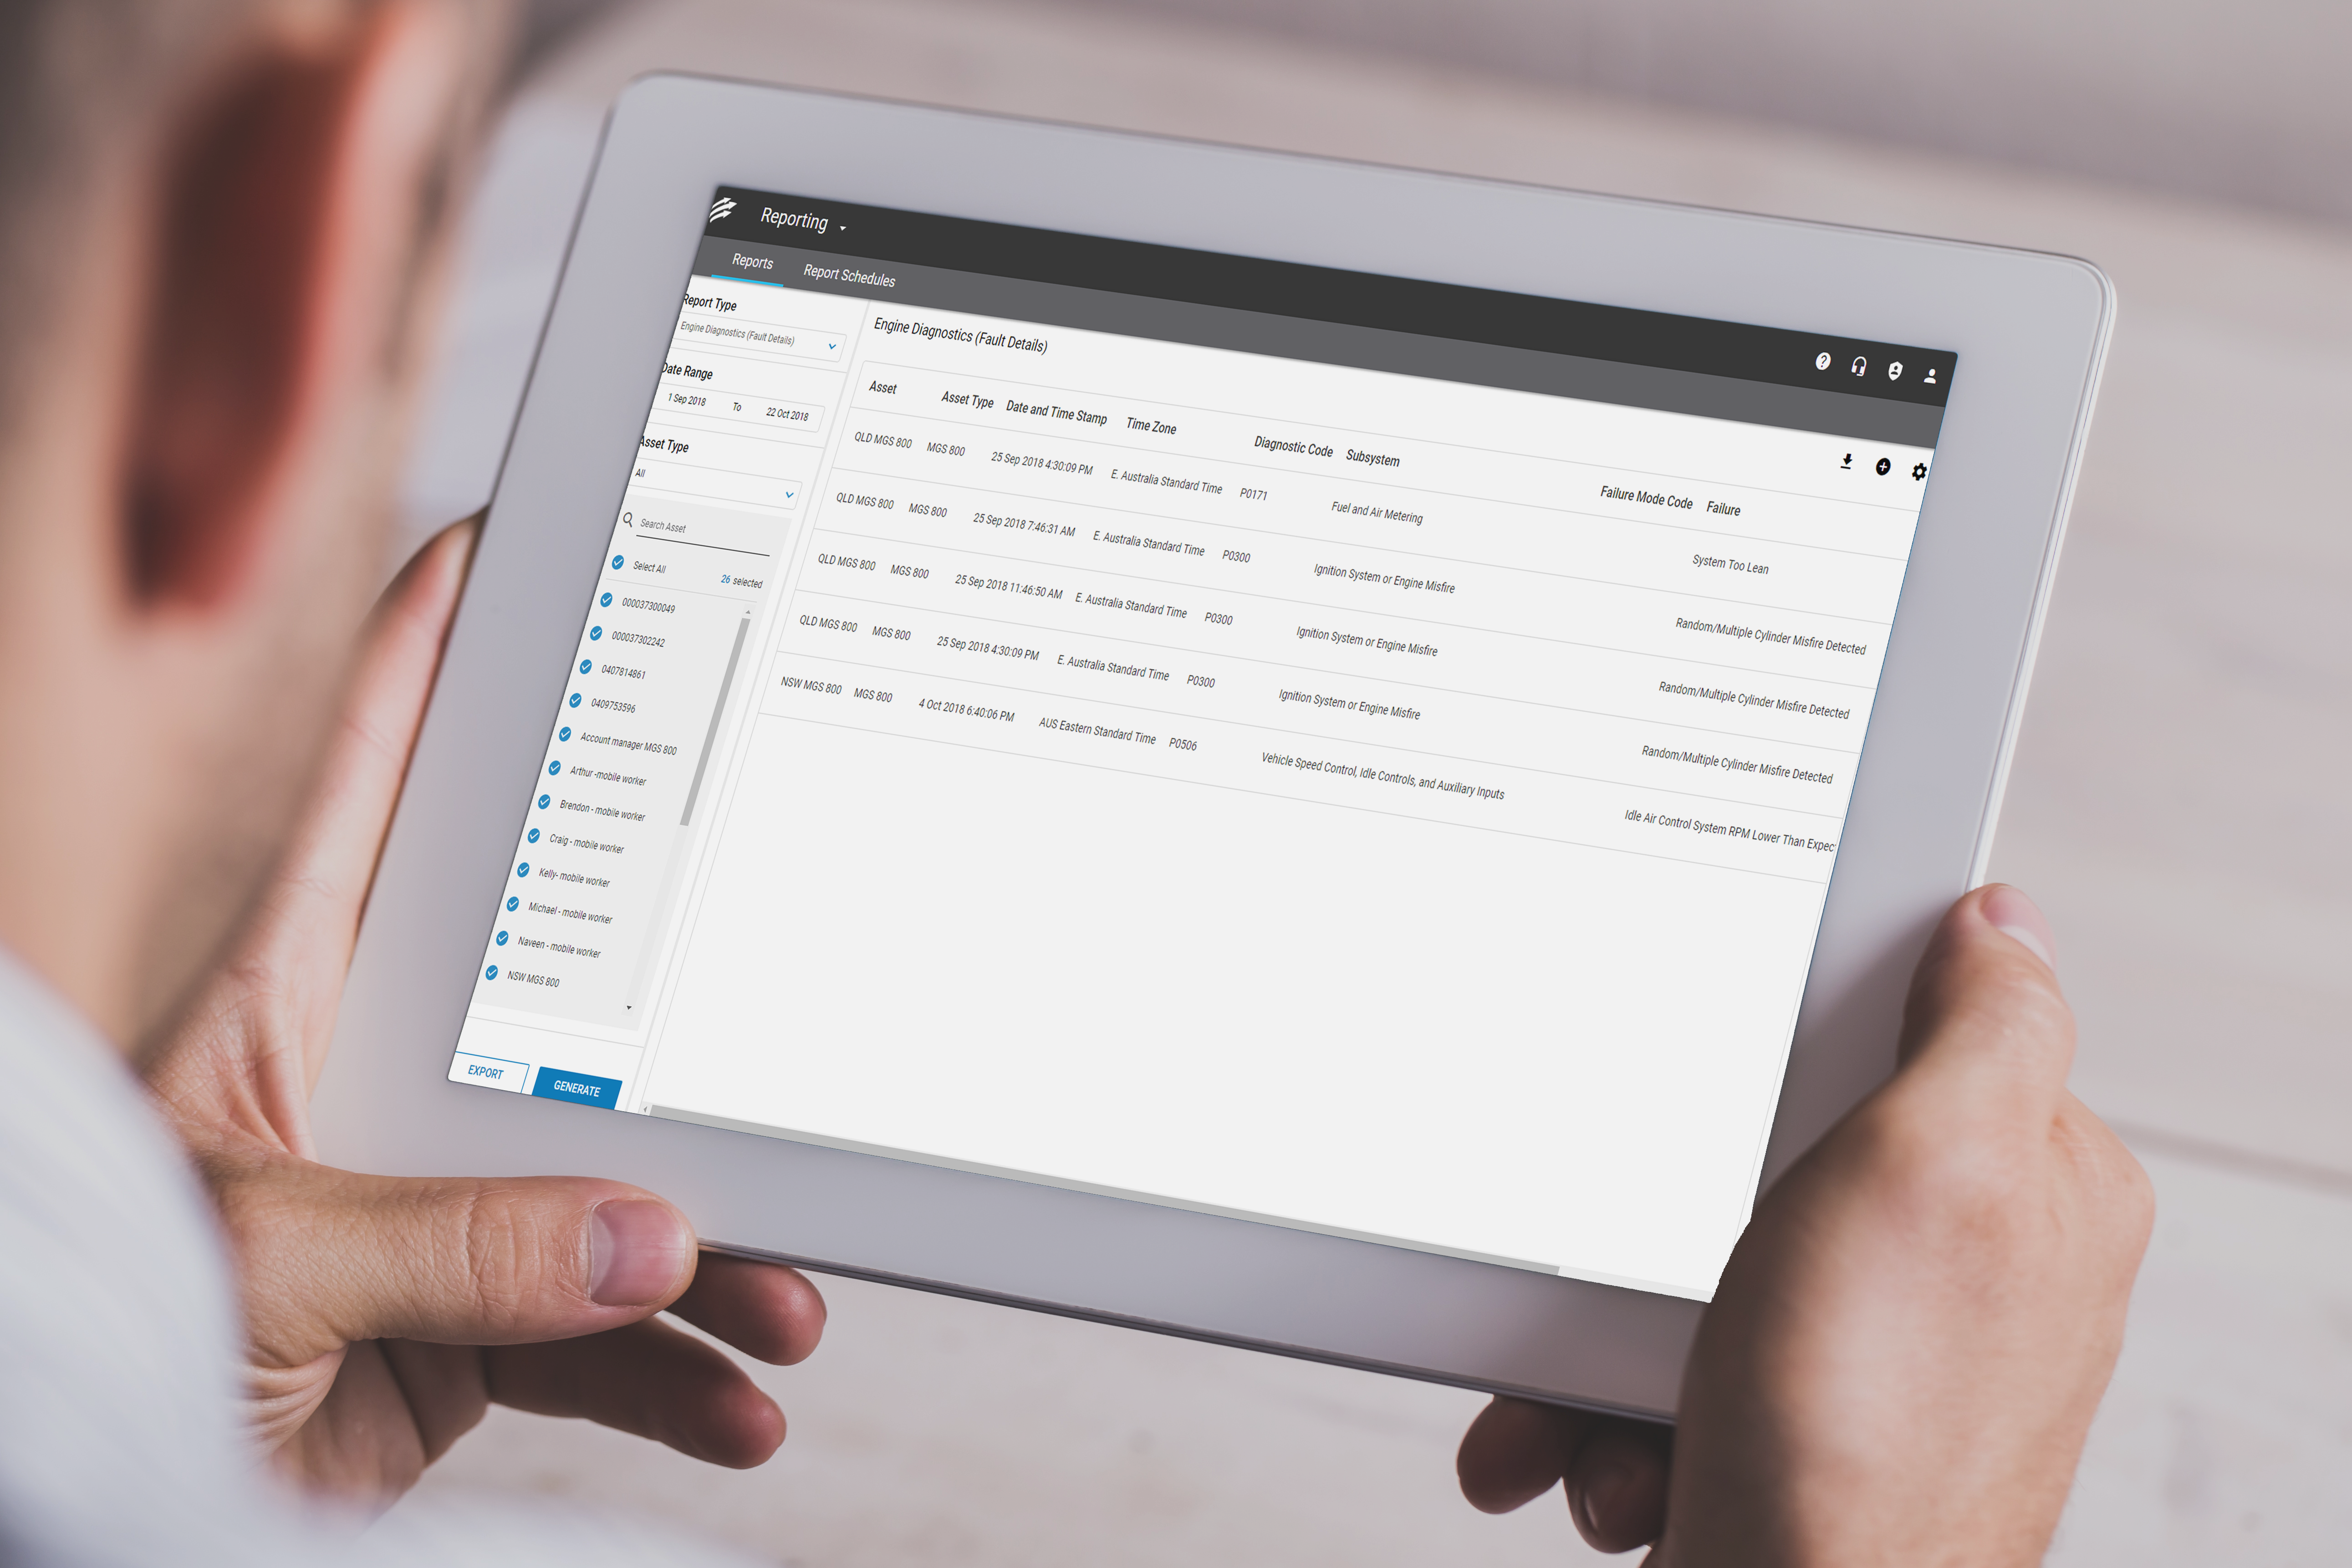
image source: Adobe Stock
What is fleet efficiency?
When a business puts its focus on getting maximum output out of minimum input, it has the potential of achieving fleet efficiency. To calculate fleet efficiency, there are a few variables you need to consider including productivity, fuel consumption, emissions, routes, costs and driver safety.
How is fleet productivity measured?
Fleet productivity can be measured based on fixed and variable costs. Fixed costs include fixed expenditures such as the acquisition of vehicles, leasing and more. Examples of variable costs are fuel, tires, maintenance and labour. The following formula can be helpful to help calculate fleet productivity:
Productivity score formula
Labour productivity example:
(Total Hours Worked) / (Shift Hours less Lunch, Breaks or Meetings, Downtime like traffic) = Productivity Score
For example:
(Drive time = 5 hours + Office time = 1 hour) / (8 hours shift – 1 hour lunch and breaks)
(5+1) / (8-1) = 86% Productivity score
You can adjust this formula as needed depending on the structure of your business.
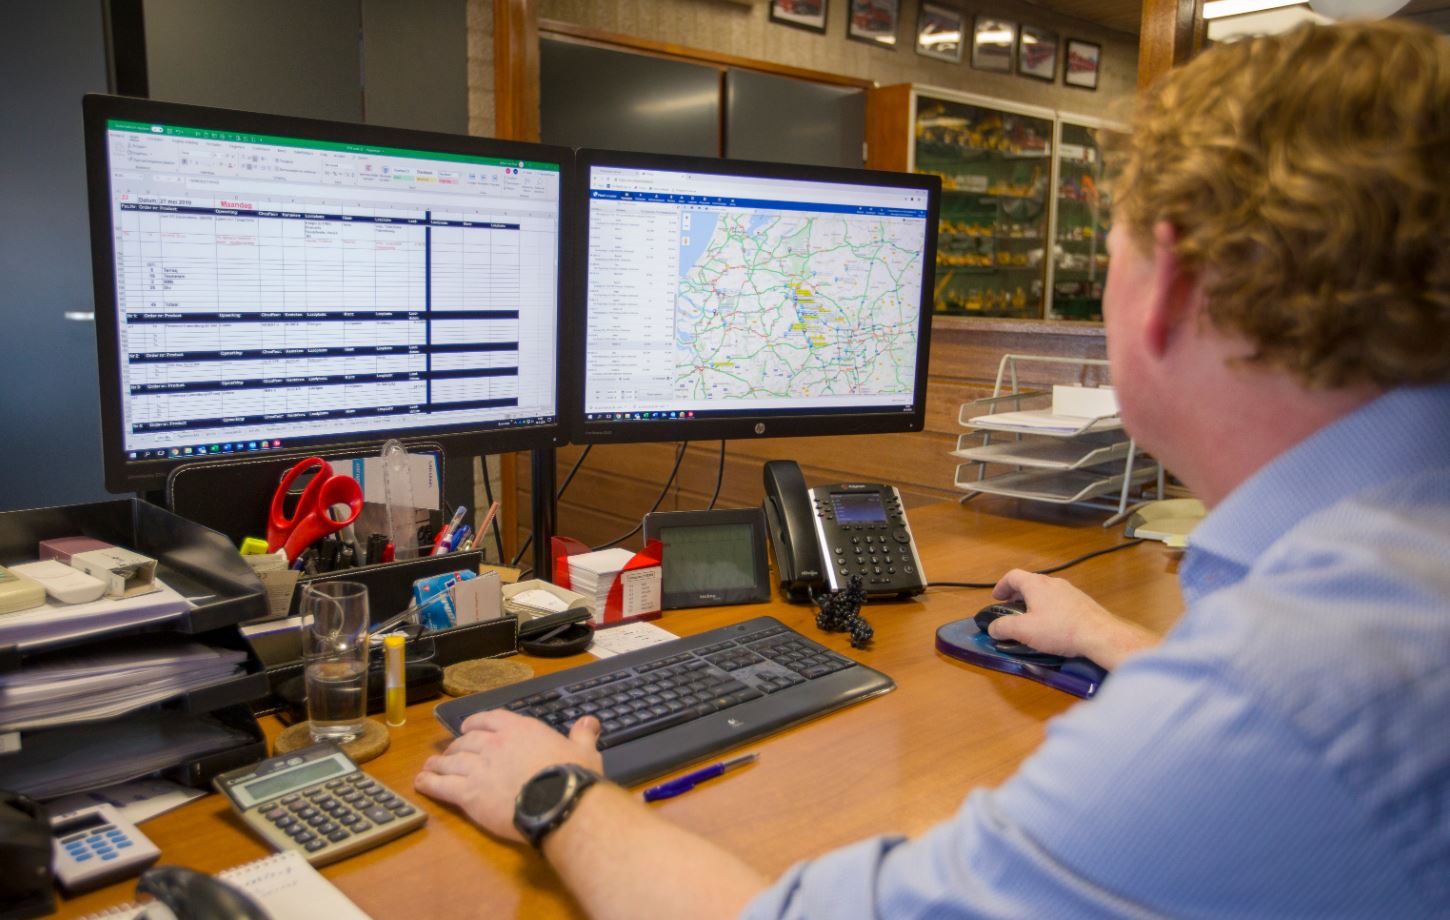
Which Geotab reports can help track and measure driver productivity?
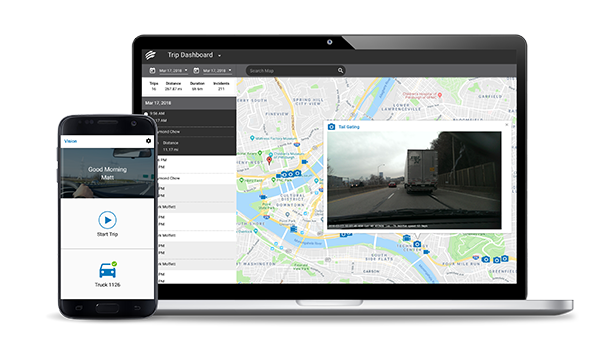
- Trips Summary Report
This report measures key metrics over time including distance travelled, driving time, idling time and zone type duration by vehicle. The Trips Summary Report helps with customer visits to see if drivers are utilizing their day to the fullest.
Video tutorial: Learn how to Run a Trips Summary Report
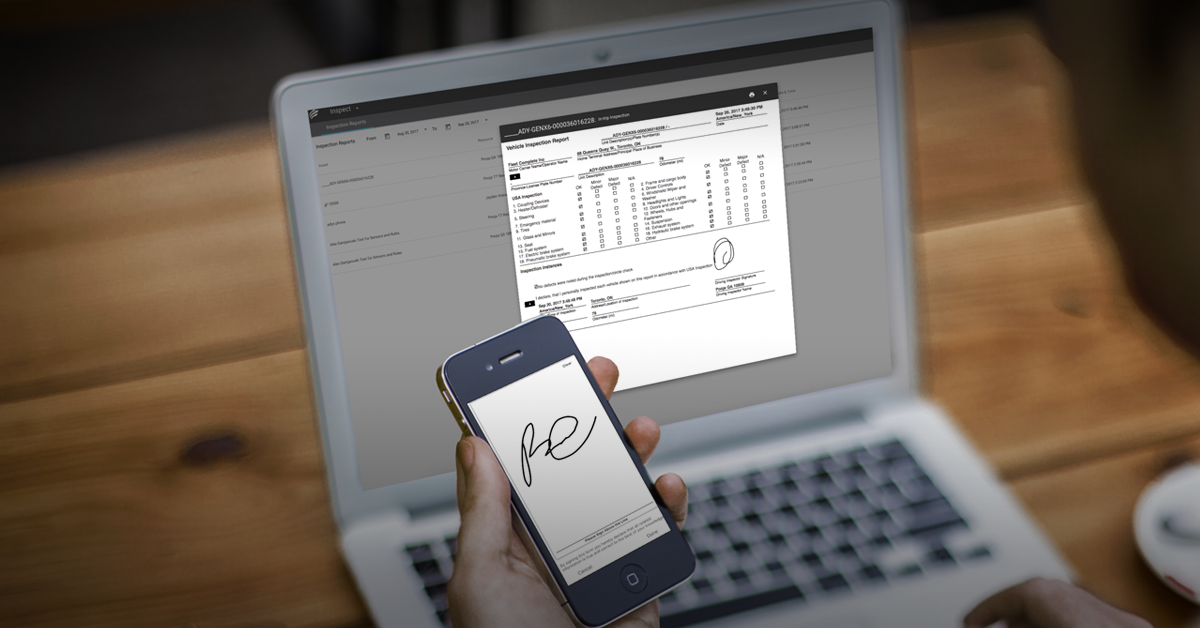
- Time Card Report
This report measures the first and the last ignition of the day, driving time, idling duration, location of the last ignition, and zone type. These key metrics can help a fleet manager analyse whether a vehicle is spending an excessive amount of time between stops or whether unauthorised stops are occurring.
Tutorial: View a Time Card Report in MyGeotab
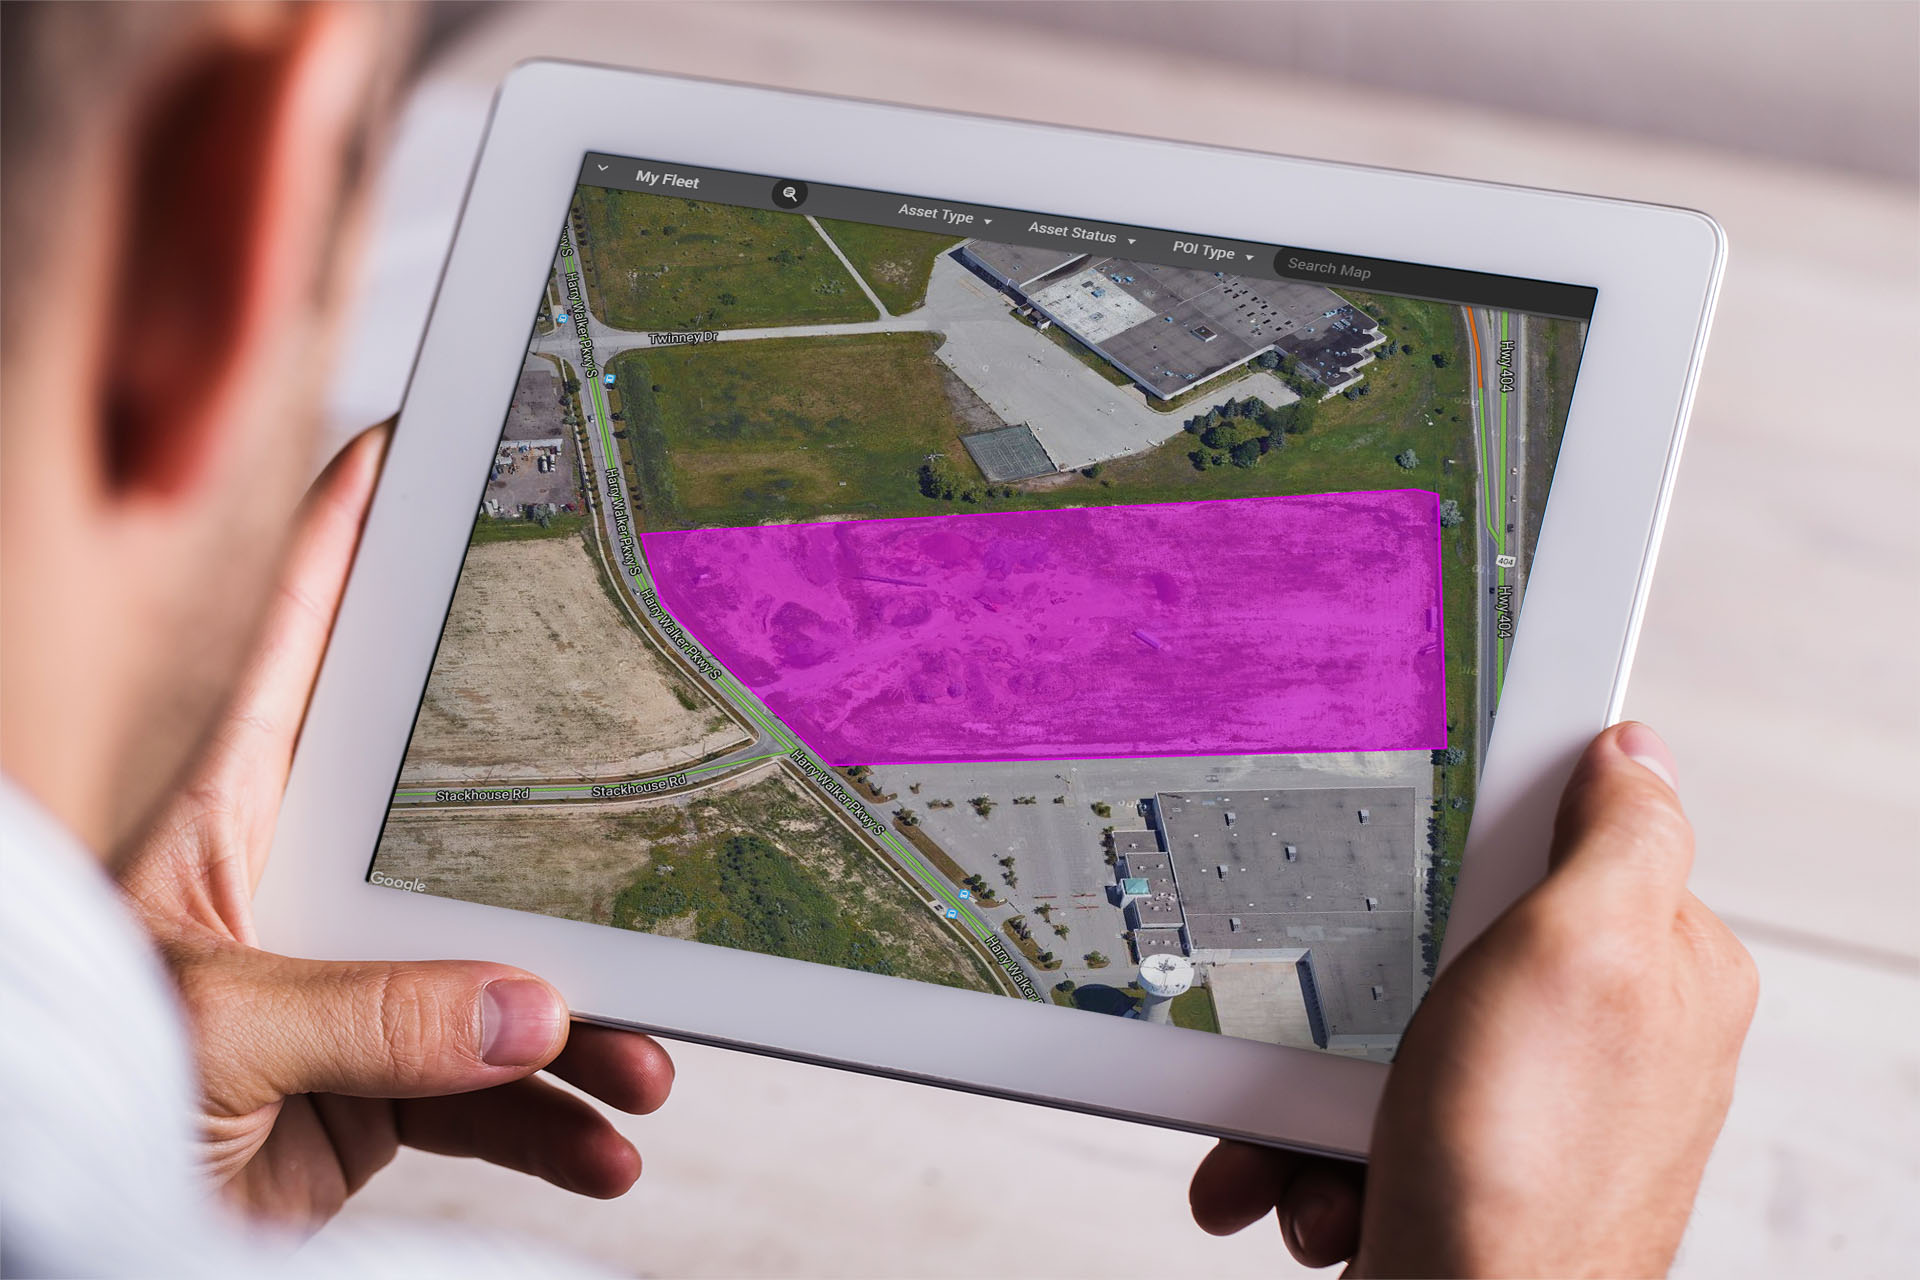
- Trips History Report
This gives a fleet manage the ability to look at a vehicle trip history to assess productivity. Businesses have the option to look at a single vehicle or assess them together to get a wider perspective of how they operate day-to-day. Both views allow insights into whether there are areas for efficiency improvement.
Video tutorial: View a Vehicle’s Trips History in MyGeotab
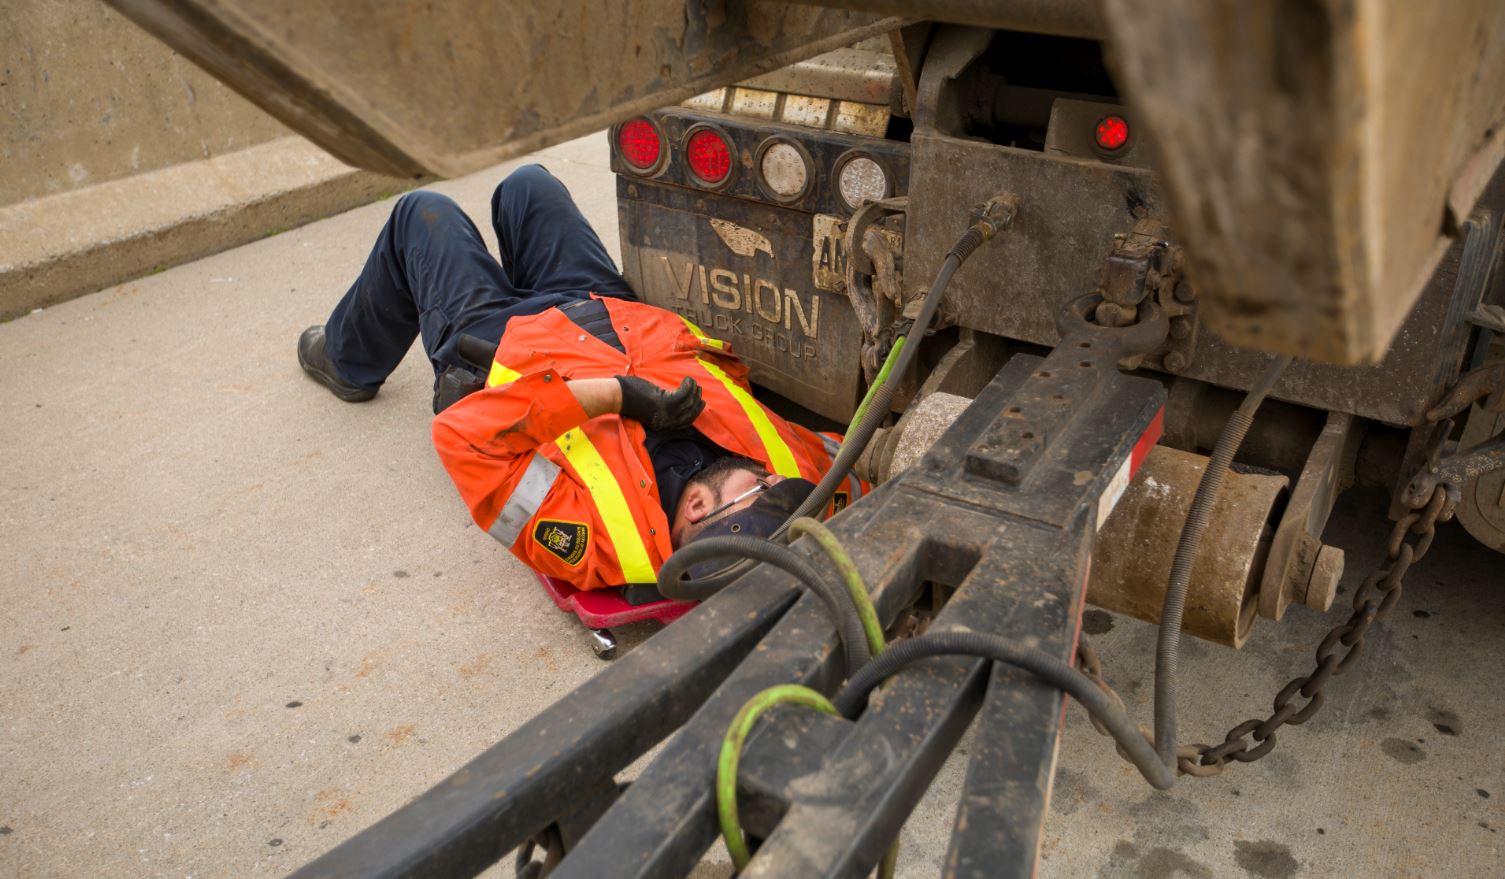
How idling can impact fleet productivity
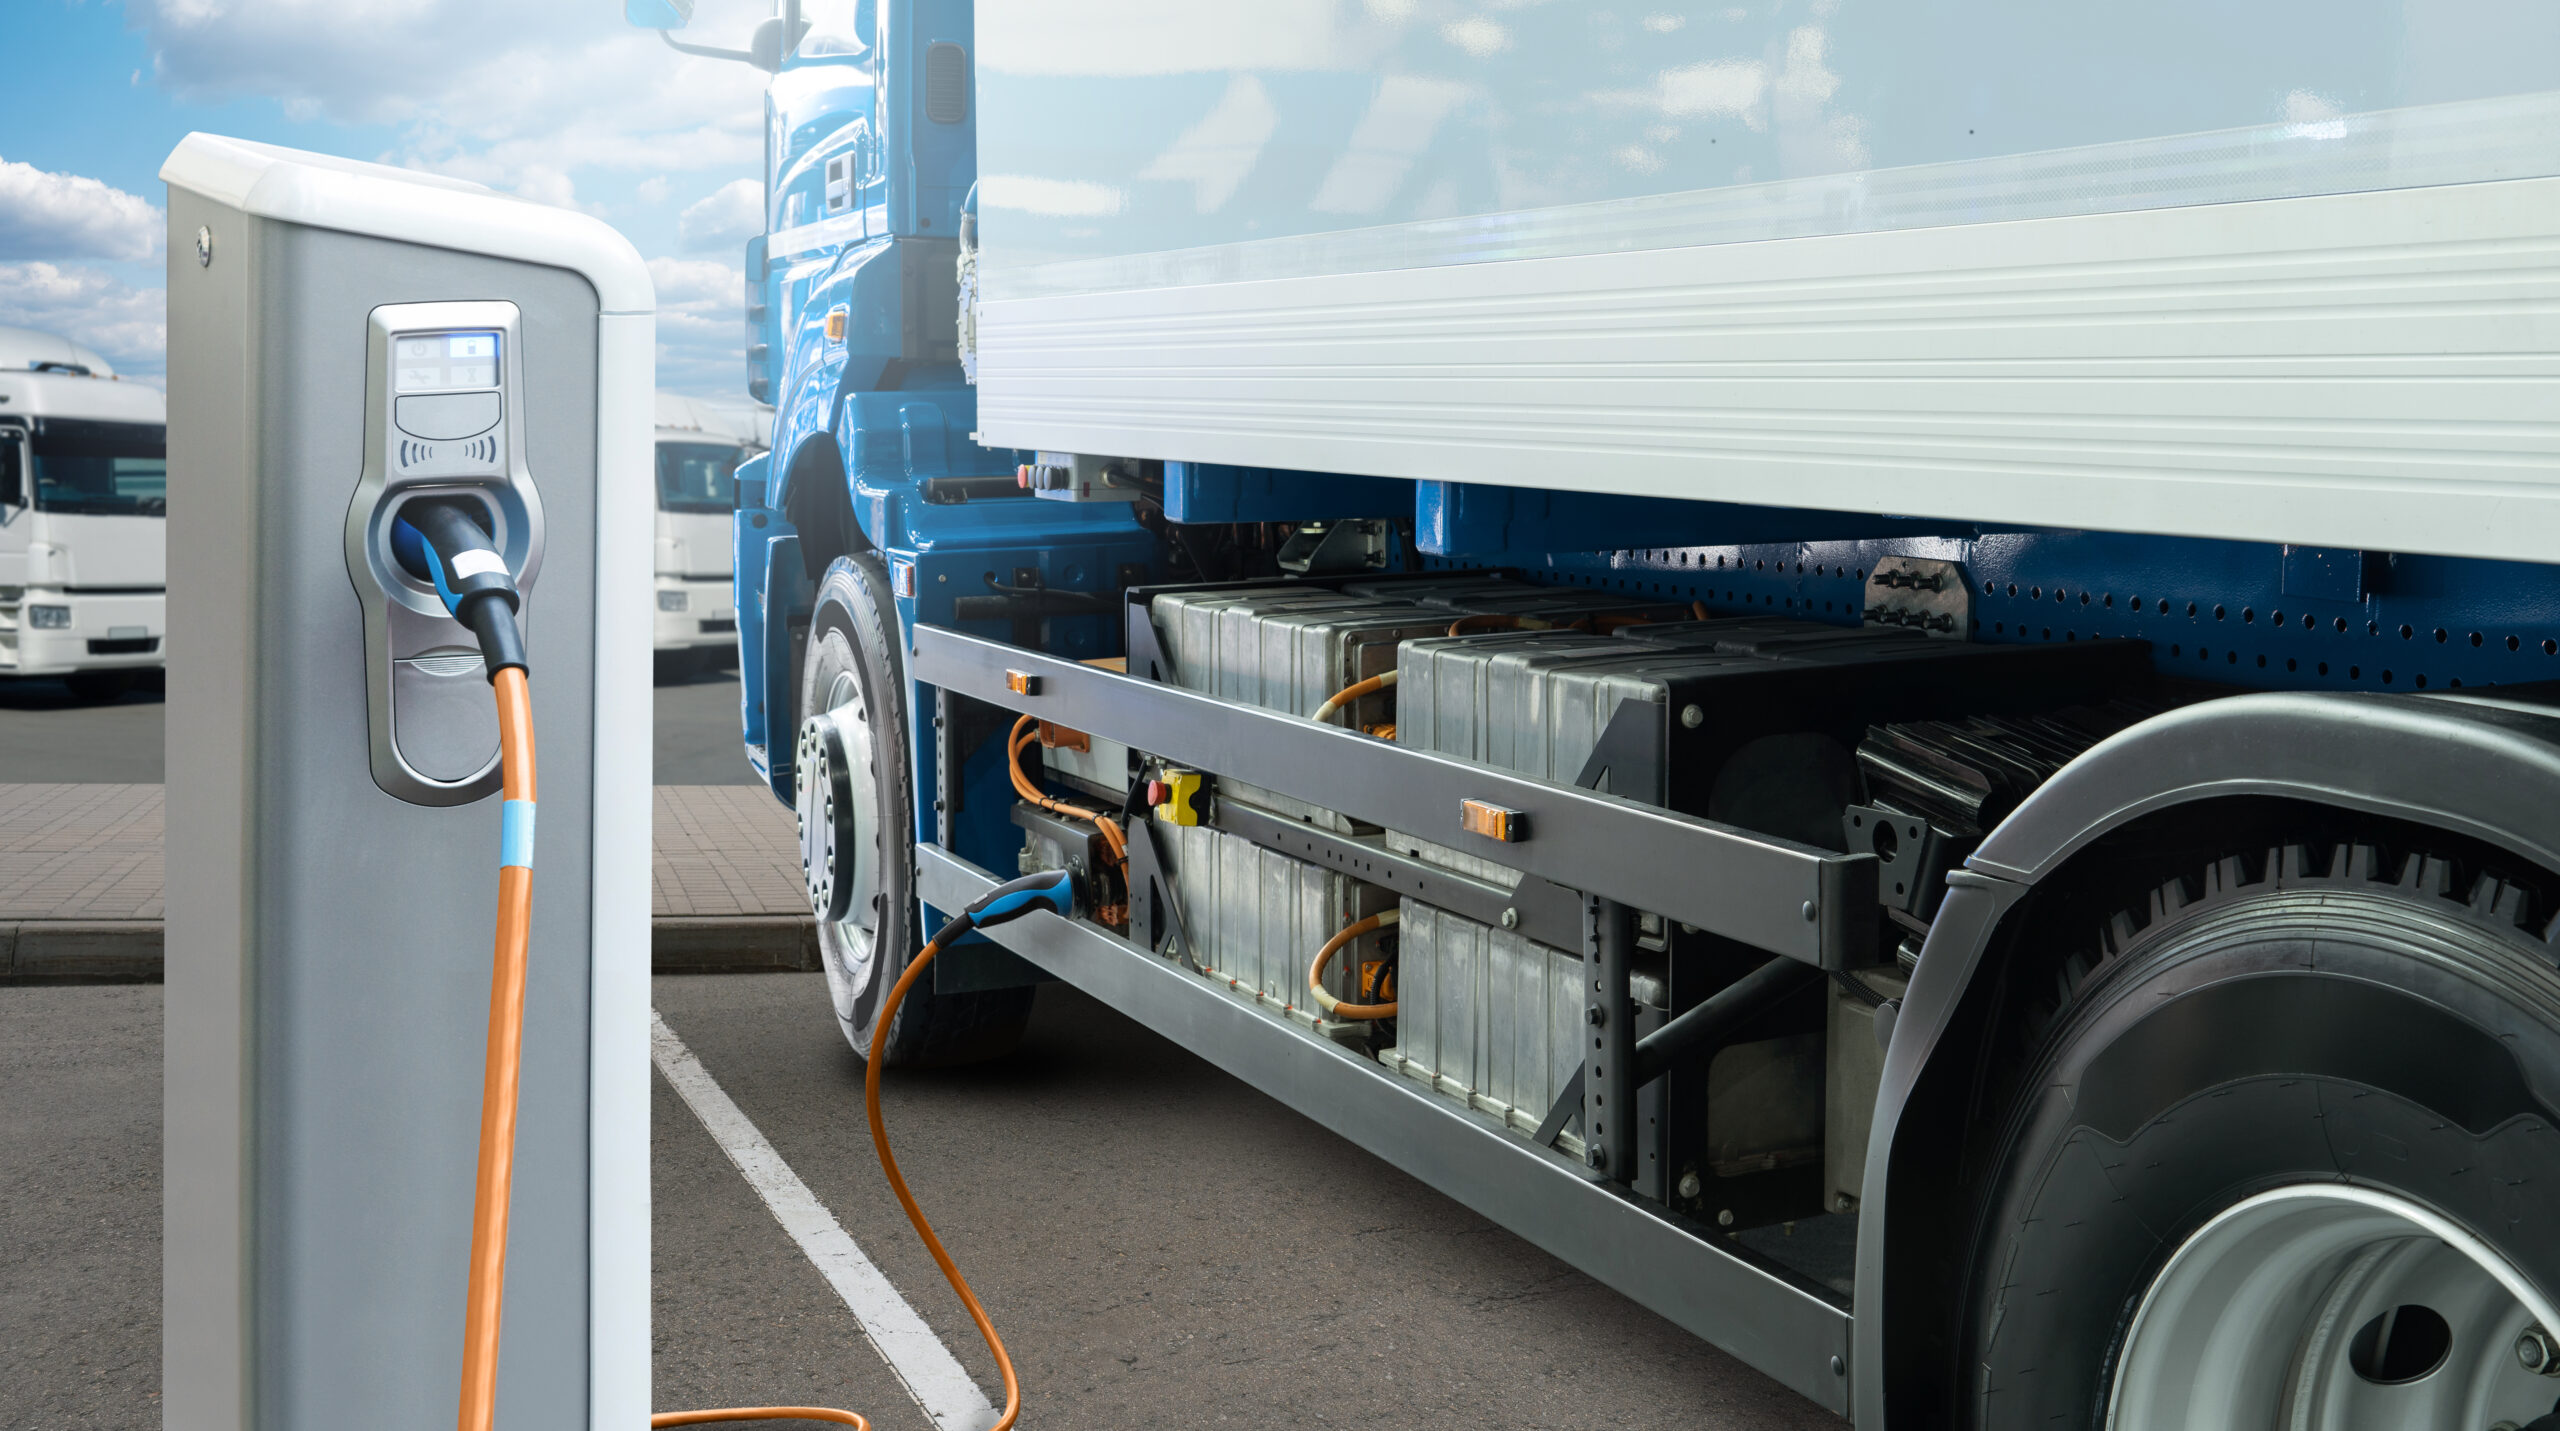
Putting a strategy in place to reduce idling is critical for productivity, whether your fleet has light, medium or heavy-duty vehicles. Not every second of idling can be removed, however longer instances can be reduced to improve efficiency.
Idling vehicles are not making deliveries or driving to their next work location, wasting fuel and time. Idling can slowly increase engine hours in your fleet which increases the frequency of maintenance needed. Reducing idling time can also help align to your sustainability goals by reducing your carbon footprint.
What are some strategies for reducing idling time?
The Geotab GO device automatically monitors idling within each trip (no setup required), but adding customizable reports and rules can make tracking idling even easier.
Here are the most effective reports for identifying and curbing idling:
- Highest Idling Duration
See the engine time spent idling versus driving, per driver, per day. This report can help a fleet manager assess whether some drivers may require further specific training. 

image sources: Geotab.com
- Weekly Idling Cost Trend
The Weekly Idling Cost Trend Report provides a rolling, seven-day view of your fleet’s total cost of idling that can be refreshed daily. This report can be used to spot trends during certain days of the week, which may correlate to specific work or job locations. Fleet managers can then assess whether changes need to be made to improve efficiency for the following week.

image source: Geotab.com
- Last 3 Months Idling Trends Report
This report displays the total fuel used while idling across the entire fleet. This report gives you a bigger overview of what is occurring within your fleet. You can use this report to assess whether or not your efforts to reduce idling have been successful. Trend reporting tools are also helpful in areas like asset utilization.
You can download the Last 3 Months Idling Trend Report from the Geotab Marketplace.

image source: Geotab.com
- Trended Exception Report
The Geotab Trended Exception Report can be found under Dashboard and Analytics in your MyGeotab database. With more than 3 billion data points processed each day, Geotab has up-to-date information on what’s happening in the fleet industry. This report can provide your fleet manager with vital current insights on idling trends, fuel economy, driver safety and more. For some businesses, this can help provide a benchmark of what they can achieve and how they can achieve it.
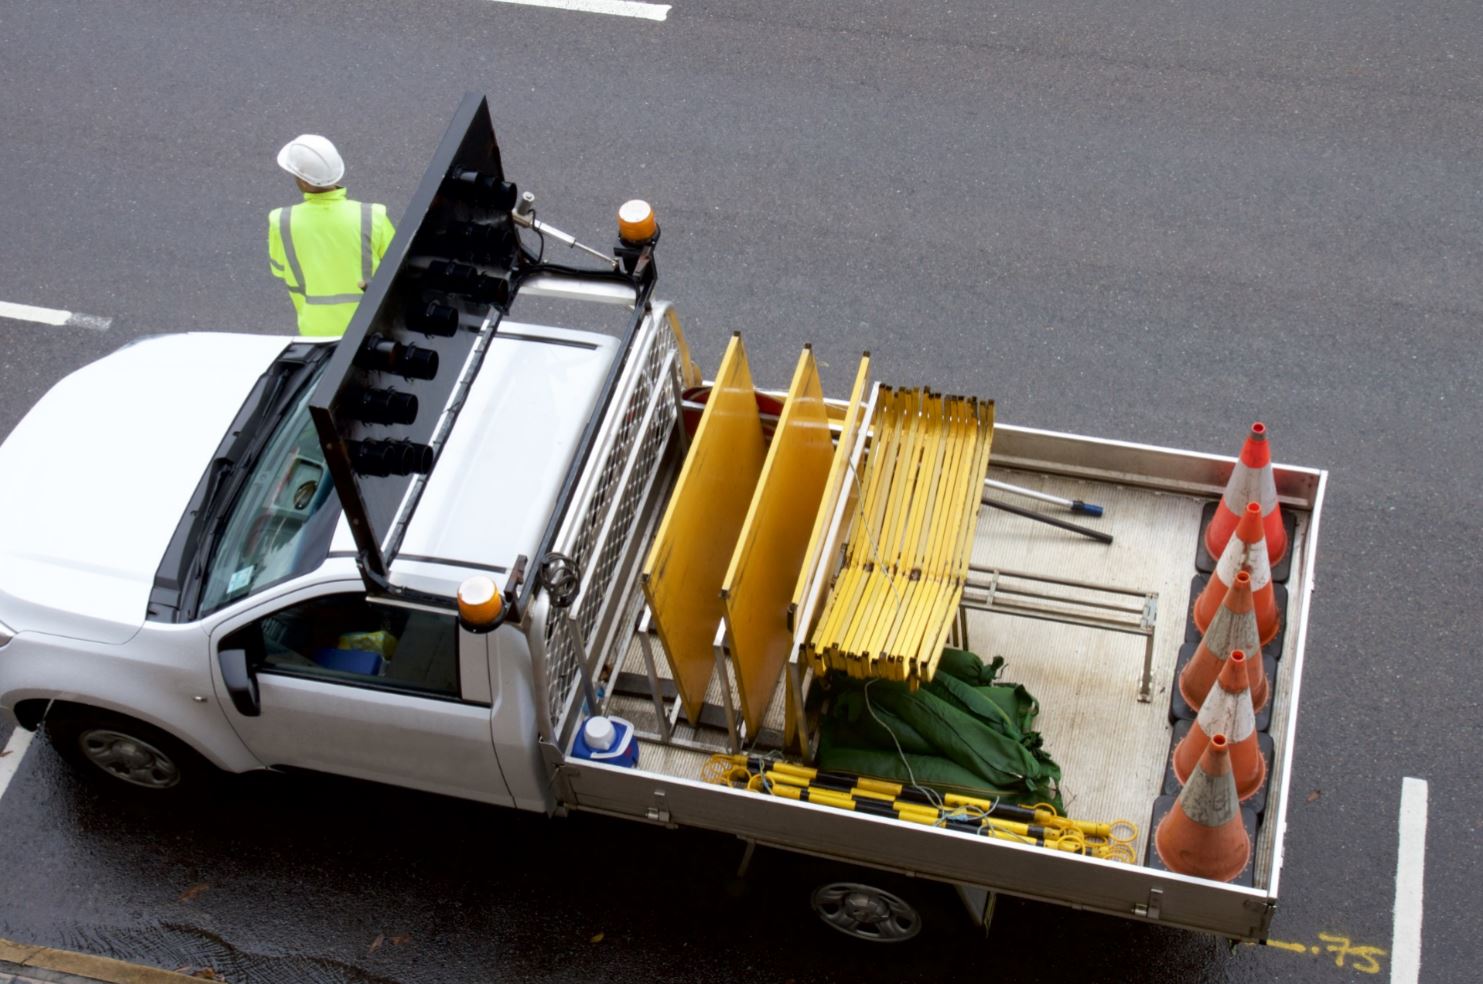
Next steps for fleet productivity
Confirm your drivers are using their time effectively by checking your productivity score and running reports regularly. Setting up idling reports is a useful next step for finding vehicles that aren’t contributing to productivity and need further management. When you are ready to take the next step, look into other fleet productivity management tools such as driver coaching, asset tracking, routing and dispatching.
Originally published by Geotab.com on March 1st 2022.
Want to speak to our specialised team? Get in touch here.